Why learn the technology we do?
R + R-studio (Posit)
– Specialization in data visualization
– Computing tools to fit models
– Well respected
– You can take these skills with you
The language has grown significantly in popularity and is now used in a range of professions including software development, business analysis, statistical reporting and scientific research
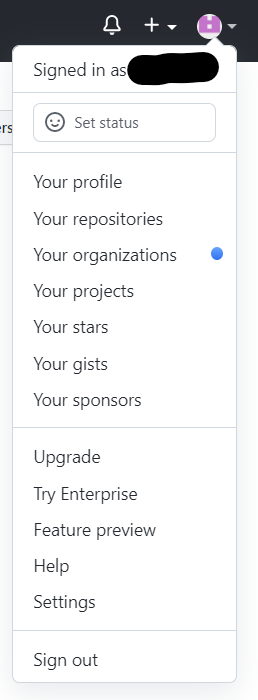
Create a GitHub account (Why?)
GitHub, Inc., is an Internet hosting service for software development and version control. ![]()
What we need to do (5 min)
– If you have not set up:
Create a GitHub account
Please do this before the Getting to know you survey
Go to https://github.com/, and create an account (unless you already have one).
Some tips from Happy Git with R.
– Incorporate your actual name!
– Reuse your username from other contexts if you can, e. g., Twitter or Slack.
– Pick a username you will be comfortable revealing to your future boss.
– Be as unique as possible in as few characters as possible. Shorter is better than longer.
– Avoid words with special meaning in programming (e.g. NA).
Slack
![]()
https://slack.com/get-started#/createnew
R-Studio
– Reserve a STA198-1991 RStudio container
– Go to https://cmgr.oit.duke.edu/containers
– Click Reserve Container for the STA198-199 container
Some R essentials
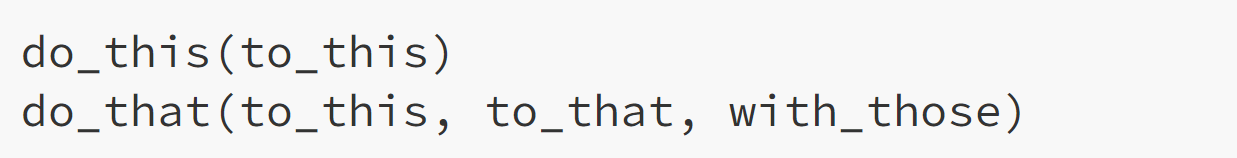
– Functions are (normally) verbs, followed by what they will be applied to in parentheses:
R essentials
– Packages are installed with the install.packages function and loaded with the library function, once per session.
– If you are using R through the container, almost all packages are already installed for you!
Packages
library(tidyverse)
Packages
library(tidyverse)
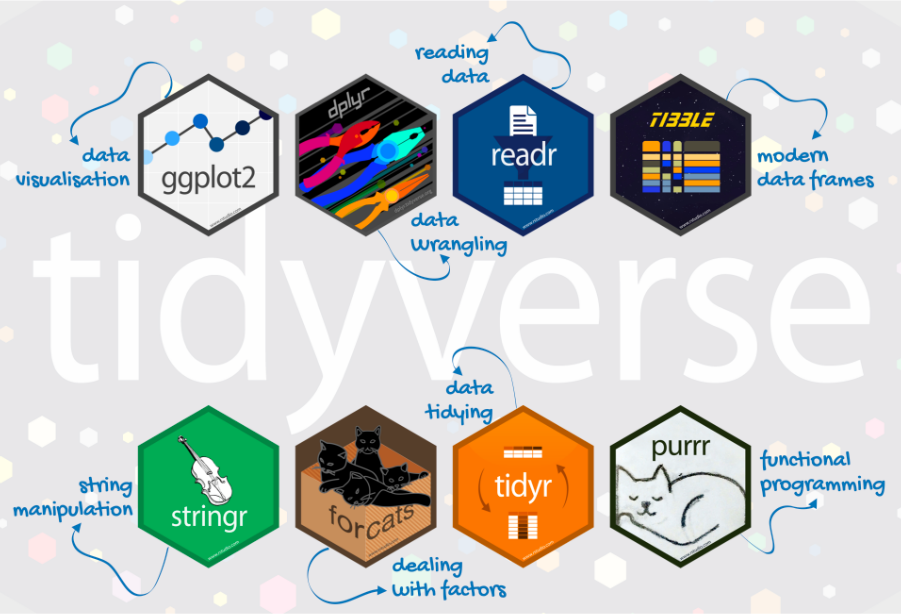
tidyverse
– The tidyverse is a collection of R packages designed for data science.
– All packages share an underlying philosophy and a common grammar.
Quarto
– an open-source scientific and technical publishing system
– publish high-quality articles, reports, presentations, websites, blogs, and books in HTML, PDF, MS Word, ePub, and more
– Code goes in chunks, defined by three backticks, narrative goes outside of chunks
How will we use Quarto?
– Every assignment / lab / project will be given to you as a Quarto document
– You will always have a Quarto template document to start with
– As we get more familiar with R, the more code you will construct on your own
The process
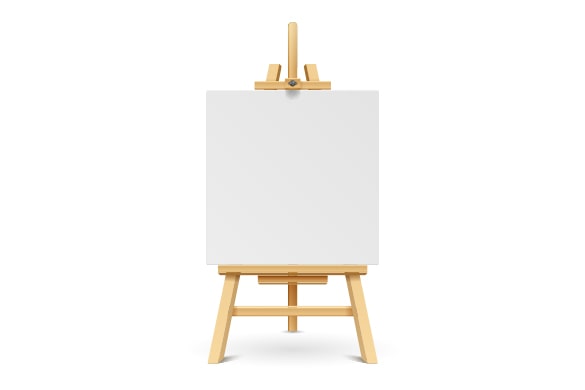
mtcars
You want to create a visualization. The first thing we need to do is set up the canvas…
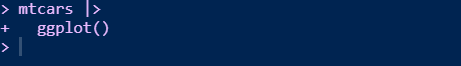
The process
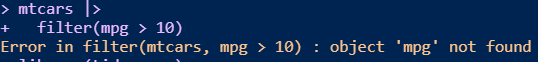
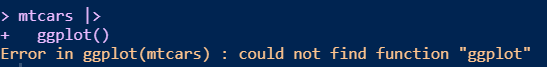
mtcars |>
ggplot()
The process
mtcars |>
ggplot(
aes(
x = variable.name, y = variable.name)
)
aes: describe how variables in the data are mapped to your canvas
The process
+ “and”
When working with ggplot functions, we will add to our canvas using +
The process
mtcars |>
ggplot(
aes(
x = variable.name, y = variable.name)
) +
geom_point()
Summary
– There area lot of moving parts in this course
– Coding is not learned in a day
– Ask questions often
– What is version control? Why is it important?
– What is R vs RStudio?
– What is Quarto?
– Starting to work with code!


 {fig.align = “center”}