Data Viz + Data Wrangling
Day 3
Dr. Elijah Meyer
Duke University
STA 199 - Summer 2023
May 22nd
Checklist
– Clone ae-03-summer-your-user-name using the SSH key
Note: if you do not see an ae-03 specifically for you, you have not accepted your org invite
Announcements
– AE’s are being graded: We will demo how to turn AE’s in today
– Keep up to date with Slack
Goals for today
– Finish off data visualization
– Introduce dplyr functions
– Continue R practice
Warm up
Identify which plot eachgeom creates
– geom_point()
– geom_density()
– geom_boxplot()
– geom_bar()
Warm Up #2
What is the difference between |> and + ?
Warm Up #3 (Reading Practice)
penguins |>
 ggplot(
 aes(x = body_mass_g, fill = species )) +
 geom_histogram(binwidth = 200, alpha = 0.3)
Types of variables
Types of variables
Type is how an object is stored in memory.
– glimpse is a great way to check data types
– Can also use typeof()
Examples
– glimpse(mtcars)
– typeof(mtcars$mpg)
Types of variables
Some of the types of variables include:
– “logical”
– “integer”
– “double”
– “character”
– “factor”
logical
– logi in glimpse
– The logical data type in R is also known as boolean data type. It can only have two values: TRUE and FALSE.
– as.logical can turn a variable into a logical. False = 0; True everything else
integer
– int in glimpse
– Integers are whole numbers (those numbers without a decimal point)
– as.integer can turn a double into an integer. Forces 22.8 -> 22.
double
– dbl in glimpse
– Real numbers (can include decimals)
– as.doublecan force a column to be a double. Identical to as.numeric.
character
– chr in glimpse
– Character string (text)
– as.character attempts to coerce its argument to character type
factor
– fct in glimpse
– Factor in R is also known as a categorical variable that stores both string and integer data values as levels.
– factor attempts to coerce its argument to factor type
Why this matters
am: Transmission (0 = automatic; 1 = manual)

Why this matters
– Functions
– Plotting
– Summary statistics
General takeaways
– Can you identify variable types
– Often need to turn something into a factor to make it categorical
– Often need to turn something into a double (numeric) to make it quantitative
Today’s live coding topic (Data Manipulation)

Data Manipulation
– Want to subset
– Want to manipulate
– Want to create
… from data
Function of the day (saw on lab-0)
Themes are a powerful way to customize the non-data components of your plots: i.e. titles, labels, fonts, background, gridlines, and legends.
theme()
– https://ggplot2.tidyverse.org/reference/theme.html
– I often use it for legend manipulation… but there is so much more!
ae-03
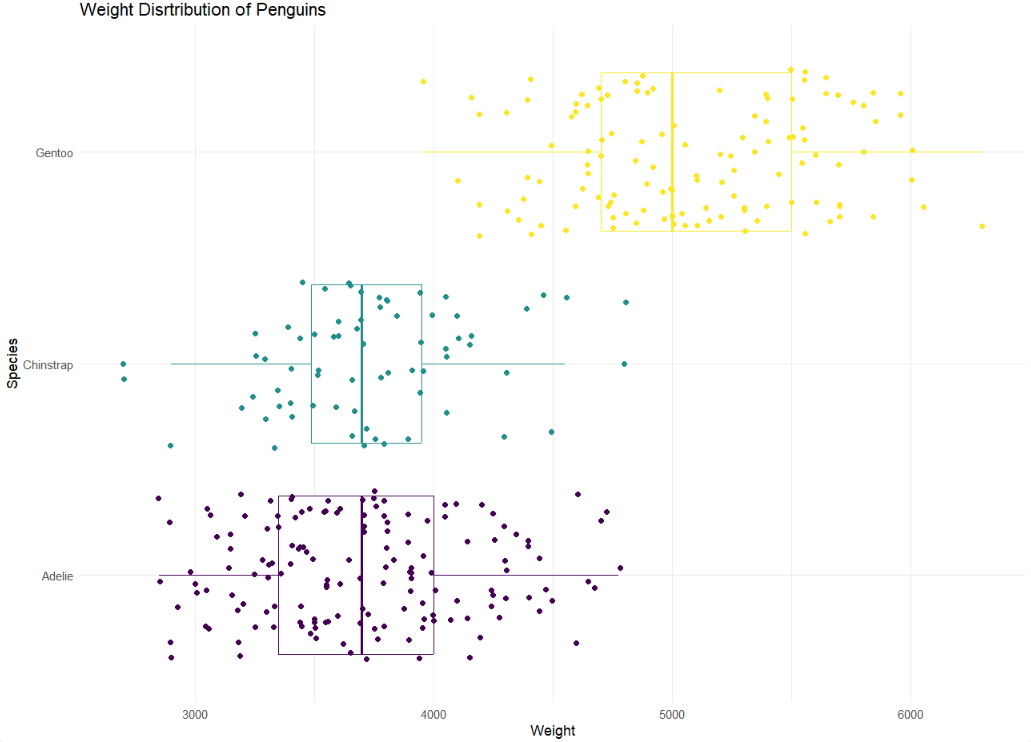
Plot Recreate

Wrap up
– Data types matter. Get in the habit of checking them at the beginning of analysis
– Have the tools to create new variables, calculate summary statistics, etc. that accompany strong visualizations
– Have the tools to manipulate data to be in a more usable format
