More Model Selection + Logistic Regression II
Day 11
Dr. Elijah Meyer
Duke University
STA 199 - Summer 2023
June 12th
Checklist
– Clone ae-11
– Homework 3 Due Tuesday (6-13)
– Project Proposal due tonight (6-12)
— Turn in on GitHub
— Feedback coming in the next day or two
Feedback for your project
– Will be on GitHub Issues
— Demo
Warm Up: Question
What are the main differences between:
– Simple Linear Regression vs Multiple Linear Regression
– Logistic Regression vs Linear Regression
Warm Up: Logistic Interpretation
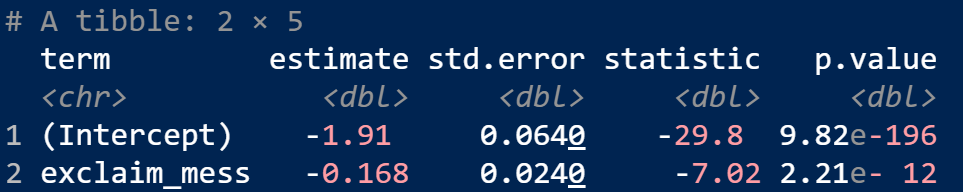
Recall: Fit a logistic regression model to predict if an email was spam or not.
![]()
– Interpret the estimate associated with exclaim_mess
– Using this output, how can we calculate probabilities of a spam email?
Note: If you are interested in log-odds, I found this small article useful here
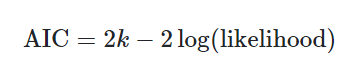
AIC in R
– glance(model1)$AIC
AIC vs Adj-R-squared
– Common to see AIC and Adj-R-squared used for model selection
– The differences are more clear in a theory course. In there own way, they provide evidence of the “best” model.
– In short: Use one in practice, but do not mix…
— They are built off a different theoretical foundation
Situation
Want to build a model that predicts well.
– What should that model look like?
– How do we build it?
– How do we know if it predicts well?
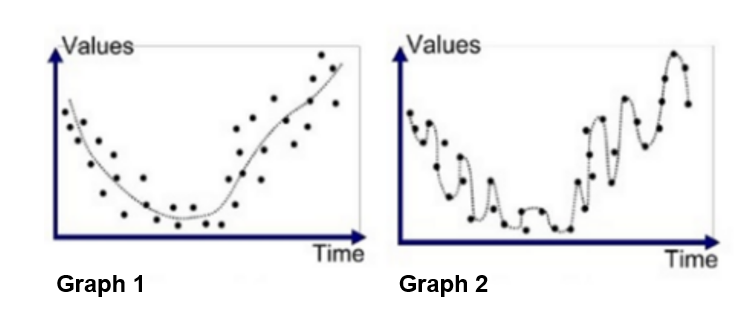
What should it look like?
Which model would you prefer?
![]()
Overfitting
– Overfitting is a concept in data science, which occurs when a statistical model fits exactly against its data.
– This doesn’t make sense if are goal is to predict!
Assessing model prediction
Vocab…
– Testing Data Set
– Training Data Set
– ROC Curve
– Sensitivity (True Positive)
– Specificity (True Negative)
Splitting the data
When the goal is prediction….
– When able, it may be advantageous to withhold a part of your data when creating your model
– Can use what’s withheld to evaluate how well your model predicts
Training Data Set
– training data is the dataset you use to build your model
– roughly 80% of a larger data set
“Sandbox” for model building.
Testing Data Set
– data to be used to evaluate your model
– evaluate the predictive performance
– roughly 20% of the larger data set
Important Note
– Training and Testing data sets are created at random
True Positive Rate
– Also known as sensitivity
– Probability of correctly detecting a “success”
False Positive
– a result which incorrectly indicates that a particular condition or attribute is present (something is not there, but we say it is)
– Incorrectly predicting the truth of “not present”
– 1 - specificity
Specificity - how well a test can classify something who truly does not have the condition of interest
Email Context
Goal: Create a spam filter (want to predict if an email is spam)
– Define a true positive
– Define a false positive
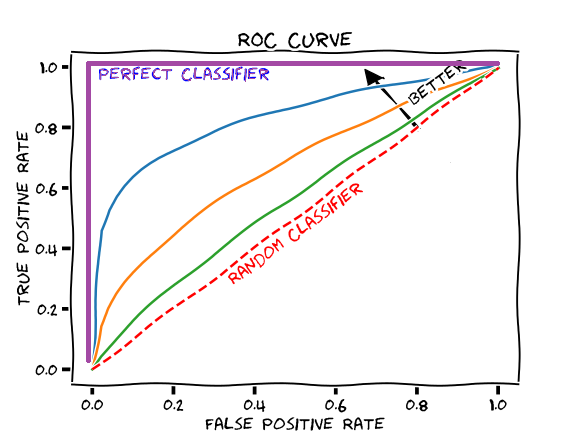
Receiver operating characteristic curve (ROC)
– Is a graph showing the performance of a classification model at different classification thresholds
– The larger the area under the curve is, the better the performance of the model across all thresholds
Motivate Discussion
How tall are Duke Students?
- We don’t know…. but we can collect data and learn more about this
Population Parameters
– What we are interested in
\(\mu\)
\(\pi\)
Population Parameters
– Are these population parameters different than some value?
– What is a range of plausible values that the population parameter could be?
General Process
– Decide what we want to investigate
– Collect data
– We need to quantify variability!
Goals
– Assess how good your model is at prediction
– Visualize how well your model predicts new observations