Working with multiple data frames
Day 4
Dr. Elijah Meyer
Duke University
STA 199 - Summer 2023
May 23rd, 2023
Checklist
– Clone ae-04
– Make sure you are keeping up with Preparation Videos
– Lab-1 due Thursday (25th before class)
– HW-1 due Monday (29th at 11:59 PM)
– All AEs for this week due Friday (26th at 11:59 PM)
Announcements
Videos
– Requesting videos for missed classes
Homework + Labs
– Late work policy
– Drop 1
Announcements
Exam
– June 1st
– Take home
– Open Notes / Internet / etc
Exam
– Coding + Short answer questions
– Extension questions
– Can NOT be late
– Pull -> Commit -> Push after every question
Questions on Content for Class
– Posted in Slack #class-questions
– Reply under the comment
– Will guide warm up questions for Thursday
Warm up
Please define the following…
– select()
– slice()
– arrange()
Warm up (2)
We glossed over this on Monday…. it needs more attention!
We can string multiple pipes together. That’s the purpose of tidyverse!
flights |>
  select(tailnum, carrier, dep_delay) |>
  arrange(desc(dep_delay)) |>
  slice(1)
Render Discussion
Why can’t I Render?
– Error in your code?
– Duplicate code chunk label?
– Are you using a function that brings up an external panel such as View()?
GitHub Discussion
Why are my changes not showing up in GitHub?
– Are you in the right project?
You can see the project you are working in in the top right corner of your screen. This MUST be the project that you cloned for the exam / assignment / lab. Do not use the files tab to go search for a file outside of your project repo.
Tibble vs Data Frame in R
In the console, type mtcars in the data set
Now, type as_tibble(mtcars)
TIbble vs Data Frame in R
– A tibble is often considered a neater format of a data frame
– Tibble has a more advanced print function
– Tidyverse functions are built to work with tibbles
https://stackoverflow.com/questions/64856424/what-are-the-differences-between-data-frame-tibble-and-matrix
Function of the day
fct_reorder
![]()
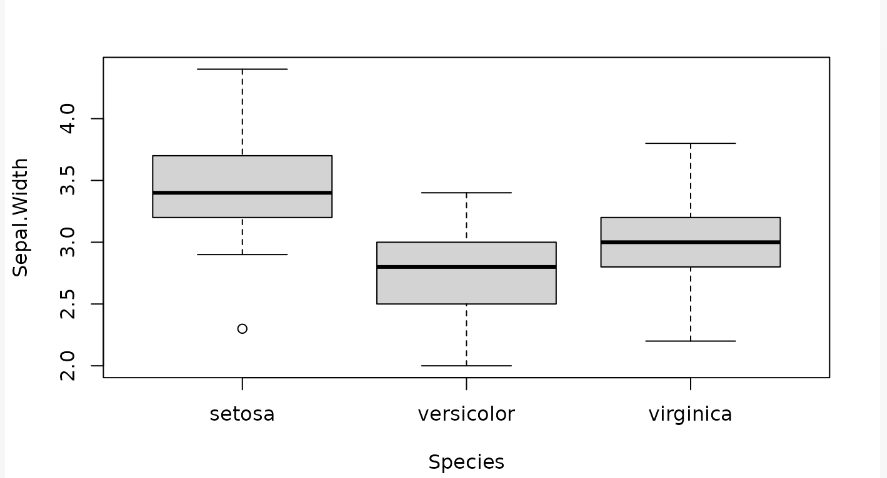
Function of the day
iris |>
  ggplot(
  aes(x = fct_reorder(Species, Sepal.Width), y = Sepal.Width)
) +
  geom_boxplot()
![]()
Goals
– Play with dplyr functions
– Understand join functions
– Join multiple data frames
Motivation
Messy data
– The sheer volume of information is sometimes referred to as “messy” data, because it’s hard to make sense of it all.
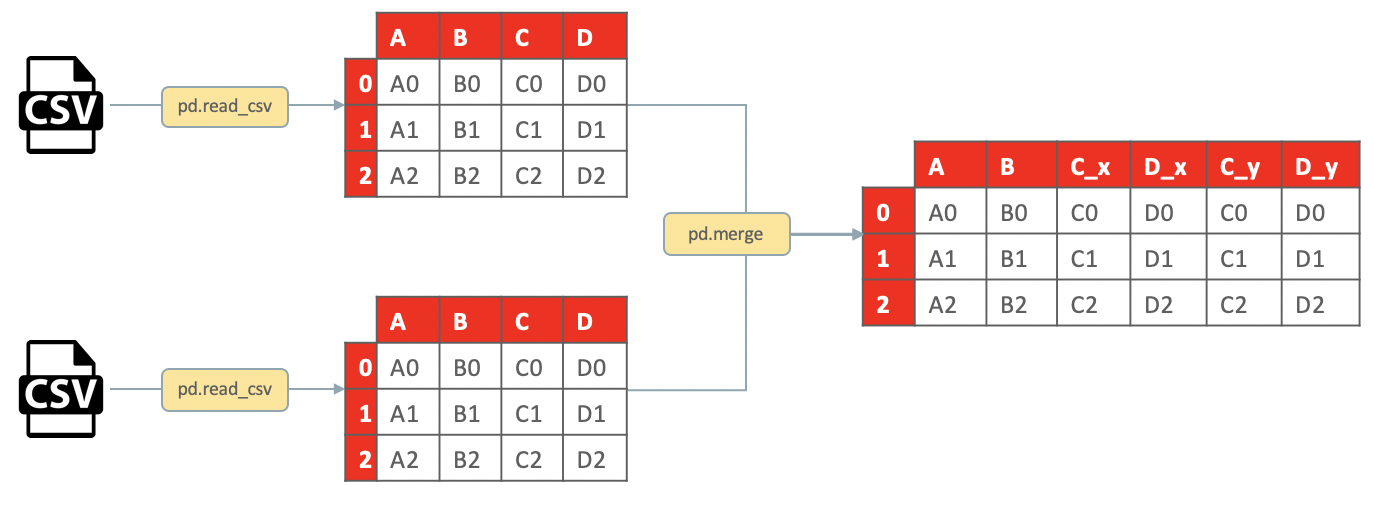
Joining datasets
Data merging is the process of combining two or more data sets into a single data set. Most often, this process is necessary when you have raw data stored in multiple files, worksheets, or data tables, that you want to analyze together.
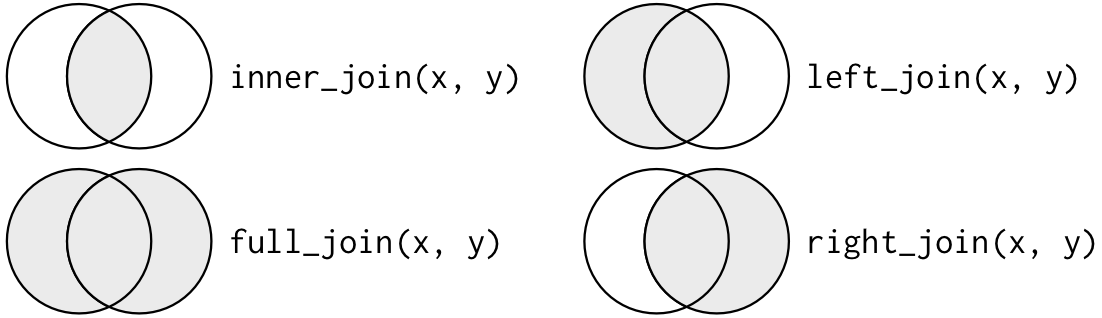
Joining datasets
– Left Join
– Inner Join
– Right Join
– Full Join
AE-04
– ae-04 part 2!
– Joining Fisheries
Recap of AE
– This is important! Data are messy!
– Think carefully about the join you use