Debugging + ggplot practice
Day-6
Dr. Elijah Meyer
Duke University
STA 199 - Summer 2023
May 30th, 2023
Checklist
Clone your ae-06 project in RStudio
HW-2 is out. Due Thursday by 5:00
Lab-02 - Team Agreement on Gradescope
Are you in a project group?
Are you keeping up with prepare material?
Announcements
– Exam 1 - June 1st
– Project is starting up!
Project
– Find a data set
– Come up with a research question
– Perform EDA
– Perform Statistical Procedure
– Give a presentation
Project
Can be found on the website
Identify 2 data sets you’re interested in potentially using for the final project.
– 300 observations
– 6 variables
Plenty of places to find data online
Project Data
Data must be real
Identifier variables such as “name”, “social security number”, etc. are not useful explanatory variables. If you have multiple columns with the same information (e.g. “state abbreviation” and “state name”), then they are not unique explanatory variables.
You may not use data that has previously been used in any course materials, or any derivation of data that has been used in course materials.
Project Proposal
Introduction and data
Research question
Literature
Glimpse
Repos will be coming soon for each group!
Exam Instructions
– You must submit a PDF document to Gradescope
– With the exception of major emergencies, late submissions will not be accepted. A last-minute technical issue is not a major emergency.
– Include appropriate labels, titles, etc. when making any plot.
Exam Instructions
– This is an individual assignment.
– You may post clarification questions on Slack in the #exam-1 channel.
– Don’t cheat
– You may use R documentation, as well as course materials (notes and textbooks), or existing internet resources to answer exam questions. You may not, under any circumstances, use ChatGPT on the exam. Doing so will result in an 0.
Exam Instructions
– PDF not submitted on Gradescope (-10 points): If a PDF is not uploaded to Gradescope by the submission deadline, the PDF at your latest commit prior to the deadline will be used as your submission.
– If there is no PDF in your repo, i.e., you’ve never rendered your .qmd file, your work will not be graded and you will receive a 0 on the exam.
– Pages not marked on Gradescope (-10 points)
Exam Questions
Will cover data viz and data wrangling
Questions will be similar
Render + Commit + Push after EVERY question
Warm-Up
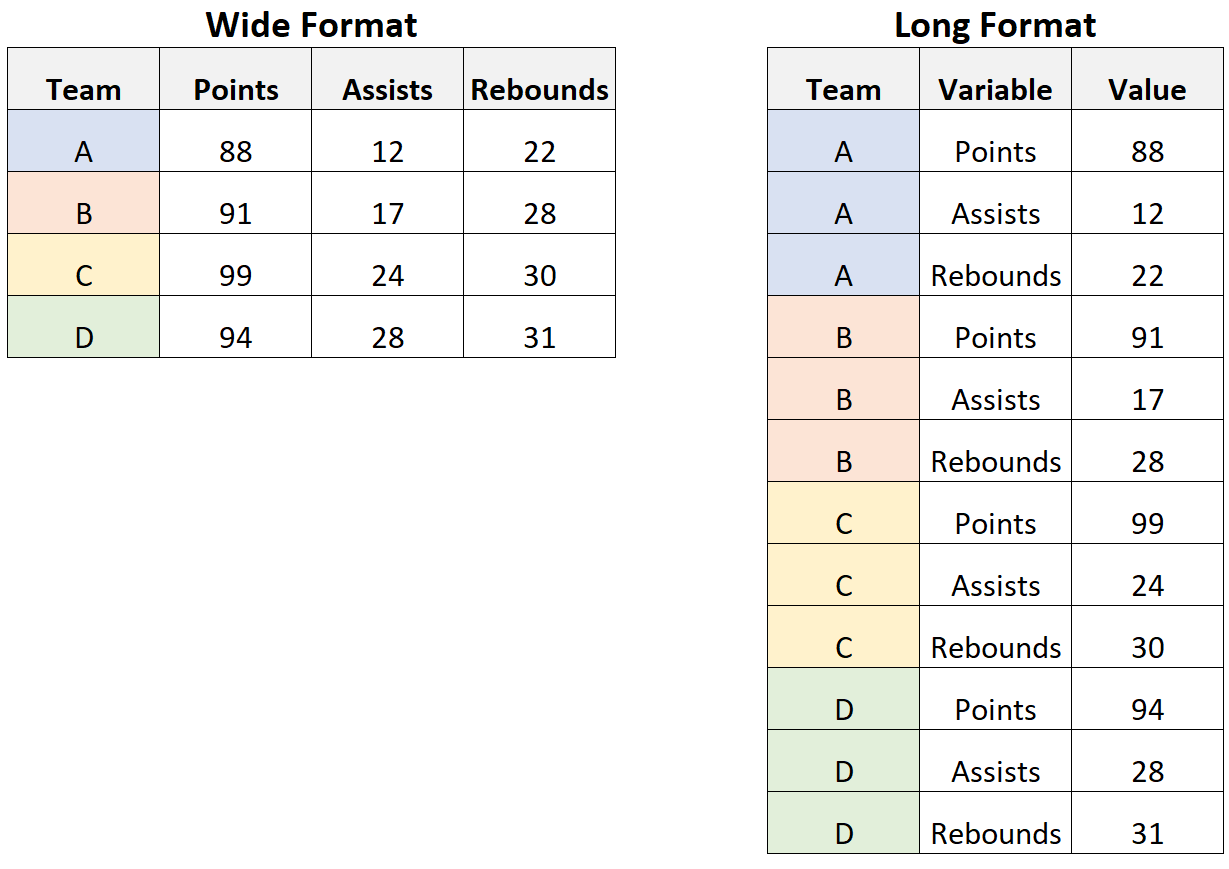
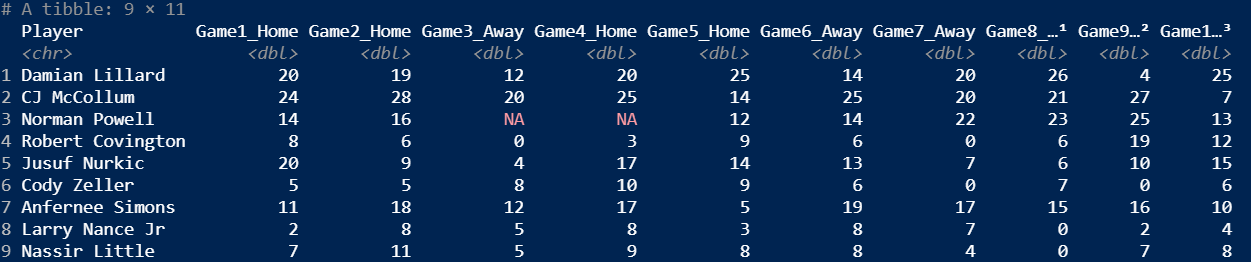
Wide vs Long Data
– What’s the difference?
Warm-Up
![]()
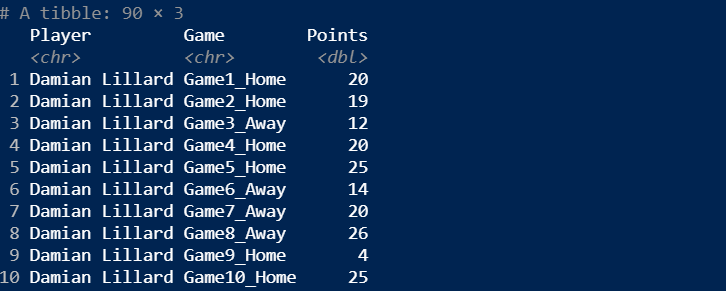
Warm-Up
![]()
new.blazer <- trailblazer |>
    pivot_longer(cols = !Player,
                 names_to = "Game",
                 values_to = "Points")
Warm-Up
![]()
Warm-Up (Go Back to Wide)
![]()
new.blazer |>
  pivot_wider(
  names_from = Game,
  values_from = Points
  )
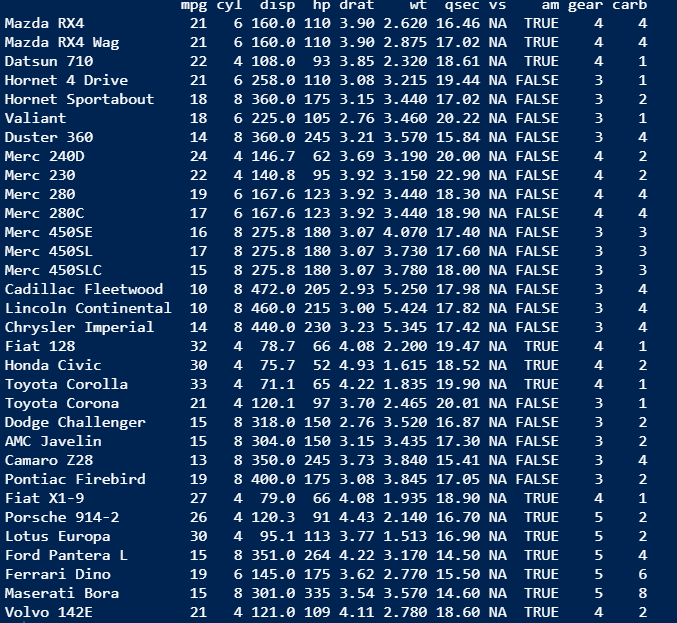
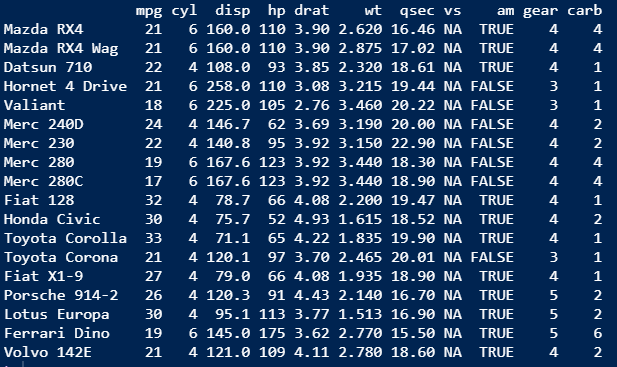
Warm-Up (Thought Exercise)
Suppose a researcher wants to subset the mtcars data set to only include cars with 4 and 6 cylinders.
![]()
Warm-Up
Two researchers set out to subset these data using the following code. What’s different? What’s correct?
Researcher 1:
cylinders <- c("6", "4")

mtcars |>
  mutate(cyl = factor(cyl)) |>
  filter(cyl == cylinders)
Researcher 2:
cylinders <- c("6", "4")

mtcars |>
  mutate(cyl = factor(cyl)) |>
  filter(cyl %in% cylinders)
Warm up
cylinders <- c("6", "4")

mtcars |>
  mutate(cyl = factor(cyl)) |>
  filter(cyl == cylinders)
![]()
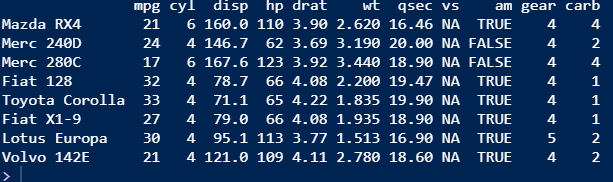
Warm up
cylinders <- c("6", "4")

mtcars |>
  mutate(cyl = factor(cyl)) |>
  filter(cyl %in% cylinders)
![]() }
}
Function of the day
nrow() and ncol()
Not seeing my changes in Git
– You can see the project you are working in in the top right corner of your screen. This MUST be the project that you cloned for the exam / assignment / lab. Do not use the files tab to go search for a file outside of your project repo.
Tips for not rendering
– External viewer error?
– Did you put View() in a code chunk? We don’t use View often, but we need to be aware that any function that calls for an external viewer will break the render.
Tips for not rendering
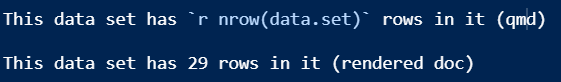
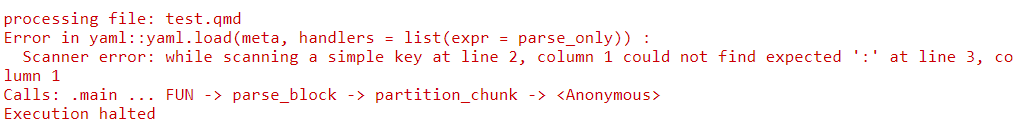
– Something wrong with your code chunk arguments?
Expected :
![]()
![]()
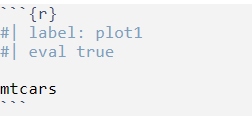
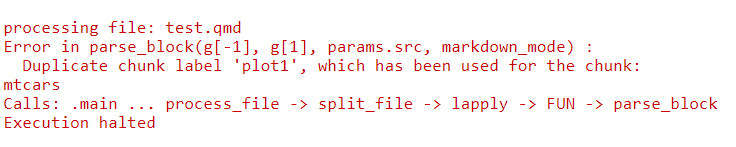
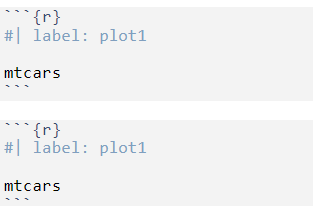
Duplicate labels
![]()
![]()
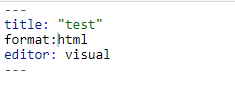
Something in the YAML
– The YAML is the metadata that tells Quarto exactly how to process or display the document. This happens in the first few lines of the document between the tick marks.
![]()
![]()
Tips for not rendering
— Does your code run? If you have errors in your code, you will also have errors when rendering the document.
Error should give you an idea about where the error is occurring.
If error can’t be found, go through question by question to find it.
General Strategies
– Help files (?function.name)
– https://ggplot2.tidyverse.org/reference/index.html
– Slack
– Keys
– Google
ae-06
– We will start with the debugging qmd.
Goal

 }
}