GitHub + ggplot practice
Day-7
Dr. Elijah Meyer
Duke University
STA 199 - Summer 2023
May 30th, 2023
Checklist
Clone your
merge-demo-summerproject in RStudio. Do not make any changes to it after you clone.HW-2 is out. Due Thursday by 5:00
Are you keeping up with prepare material?
Announcements
– Exam 1 - June 1st
– Project is starting up!
– Grading Questions
Exam
– Will be released today between 5-6
– Individual assignment only
– RENDER AND PUSH AFTER EVERY QUESTION
– Due Monday at Noon
– Slack for clarification questions
– All questions will be in the README of the exam-summer repo
– All questions will be answered in the exam.qmd
– Start early. It make take you 5 hours…. or 15…. and that’s fine!
Project
You now have your project repos!
Let’s take a tour…
Lab Expectations
– During lab, you will work on your project with your group
– After lab, you are to “table” the project until after the exam
– Project proposal due June 12th
Warm Up 1
– When you see an NA in a data set, what are some possibilities it could represent?
– Are we justified to always change NAs to 0?
Warm Up 2
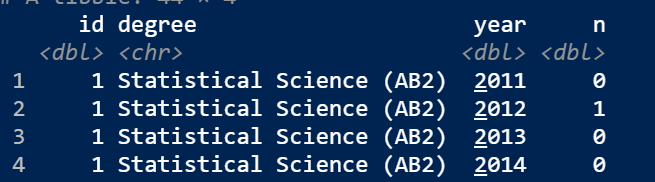
separate(degree, sep = "\\(" , into = c("major", "degree_type"))Warm Up 3
– Why do we use GitHub?
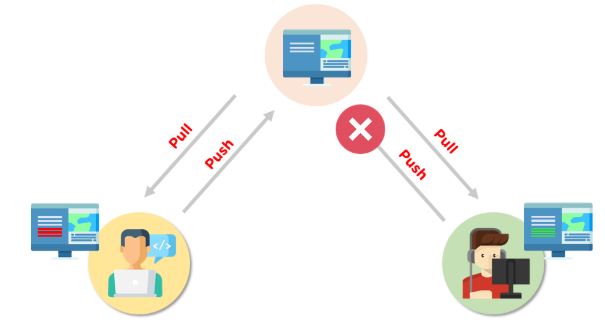
GitHub
At its core, Git keeps track of changes to files and allows multiple users to coordinate updates to those files.
GitHub
But…. not on the same lines of code at the same time…..
GitHub
GitHub
Not all merge conflicts are bad!
GitHub Rules for Collaboration
– ALWAYS PULL before starting your work
– Commit and push every and all documents. Merge conflicts occur when someone saves changes, but doesn’t push them to GitHub.
– If merge conflicts happen, we can fix (most) of them! We will talk about this during our first activity today.
merge conflict
– The first activity we will do is the merge-demo-summer activity.
– Clone this and assign a Role number 1 through 4. If you have more than 4 members, alternate.
– Do not change this document until the activity begins.
– Click on the icon under the ae_sa column on the website for today to find activity instructions.
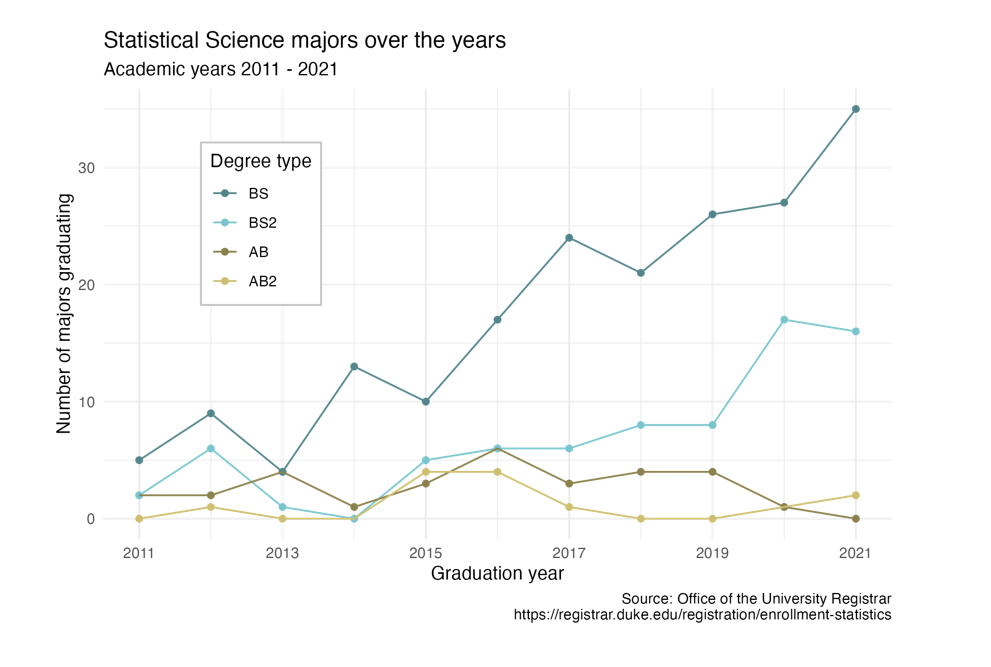
Fisheries Plot
Part 2: Statistical Inference
What is it?
– The claims that we can make from research around population parameters
- So what are population parameters?
Populatin Parameters
– Population parameters represent the truth or true summary statistics of an entire population.
We are almost always interested in these as the researcher
And we can almost never know exactly what these are….
Example
Duke Students’ Height
Statistical Inference
– Test to see if parameters are different from a value, or from each other
– Estimate population parameters
Quantifying variability
– Variability is understood as the lack of consistency. As we take samples from a population, will we always get the same value back?
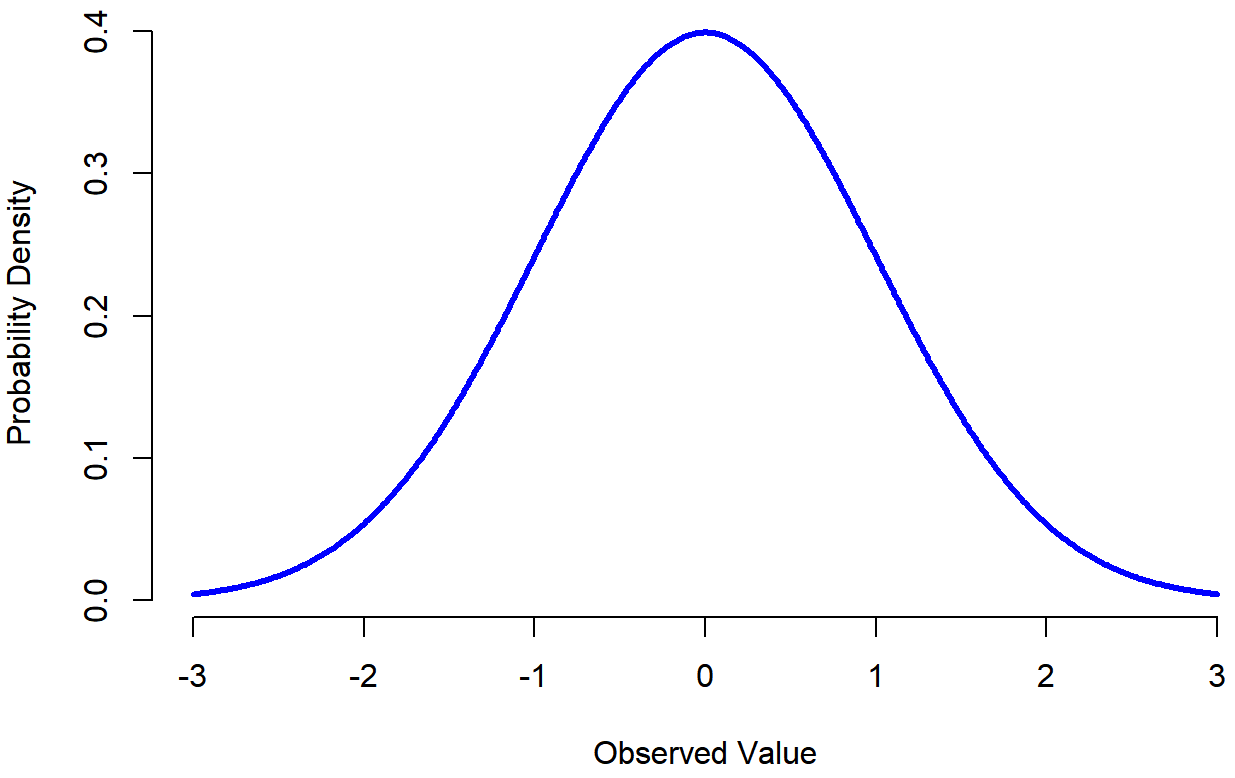
Distribution
But some values are more common and some are uncommon
We use distributions to understand that. This allows us to conduct hypothesis tests and make confidence intervals.
![]()