Statistical Inference + Simple Linear Regression
Day-8
Dr. Elijah Meyer
Duke University
STA 199 - Summer 2023
June 5th, 2023
Checklist
Clone your
ae-08.Exam-1 is over. Nice work!
Are you keeping up with prepare material?
Announcements
– Project is here! Let’s talk about it.
Project
Right now, you are working on the project proposal (June 12th)
Project draft report due (June 22nd)
Project presentation (June 29th)
Project proposal
– 2 data sets
– Research question for each data set
– Introduction for each data set
– “Literature review” for each data set
– glimpse for each data set
Research Questions
– Should be clear and focused
– Should be something that can be answered
Research Questions
– There is no recommendation to the number of variables you need to include when writing your research question. It can be between 2, it can have more than 2.
– Your research question can (and probably will) change as you get feedback / we move through the Summer session. That’s okay for this class project!
– You will answer this question using statistical procedures we will learn starting now! This includes modeling, hypothesis testing, and confidence intervals.
Examples
– What is the relationship between baldness and age?
– What is the relationship between baldness and age? Does this change based on sex?
– Does the mean age of retirement differ based on region of the US?
– What is the estiamted difference in GPA between those who live on vs off the dorms at Duke University?
Teamwork
– Everyone must contribute
– You are not guarenteed the same grade on the project as your group members
– Commit messages + group surveys
Questions on Project Proposal
Draft Report
– Introduction and Data (Updated)
– Literature Review (Updated)
– Methodology: visualizations and summary statistics relevant to your research question. You should also justify the choice of statistical method(s) used to answer your research question.
– Showcase how you arrived at answers to your research question using the techniques we have learned in class
Draft Report
The goal is not to do an exhaustive data analysis (calculate every possible statistic and perform every possible procedure for all variables). Rather, you should demonstrate that you are proficient at asking meaningful questions and answering them using data, that you are skilled in interpreting and presenting results, and that you can accomplish these tasks using R. More is not better.
Presentation
– Short 5-10 minute presentation on all of the hard work you have accomplished
– This takes place of your final exam
Warm Up
What is the true mean height for all Duke students who take Summer classes?
You don’t know….
But we can collect data and try to better answer this question!
Warm Up-2
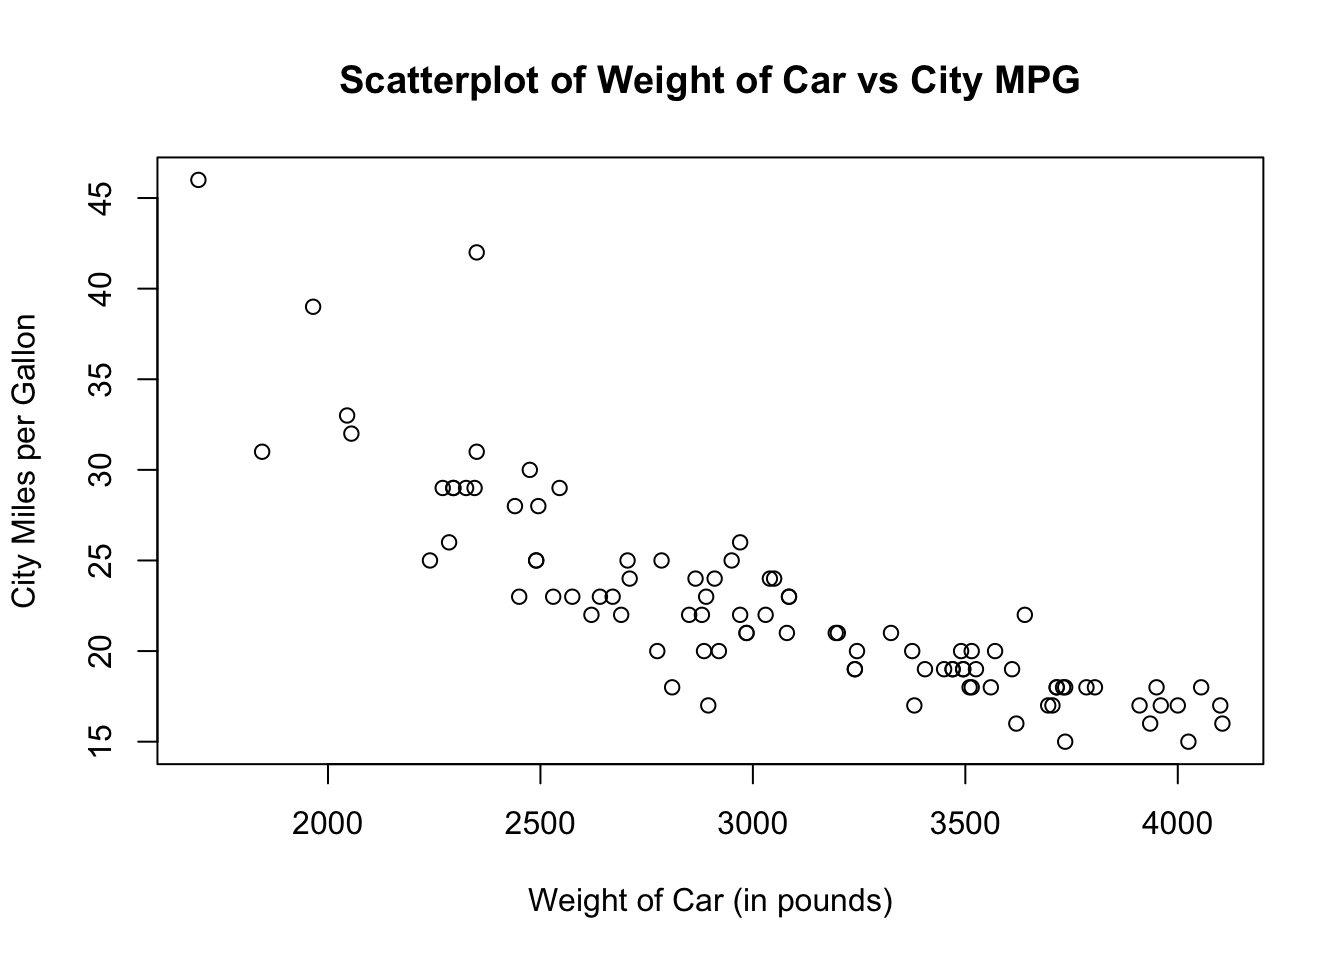
Is the weight of a car a good predictor for miles per gallon?
How many miles per gallon would we estimate a car to have if the weight was equal to 5000 pounds?
You don’t know….
But we can collect data, fit a model, and use this model to better understand relationships and make predictions!
Warm up 3
How many miles per gallon would we estimate a car to have if the weight was equal to 5000 pounds?
Goals
– Introduce the idea of modeling
— Modeling with single predictors
— How to write equations
— Interpret Slopes
— Interpret Intercepts
What is a statistical model?
– Statistical modeling is the process of applying statistical analysis to a data set.
– A statistical model is a mathematical representation of observed data.
Why
– Interpretation
– Prediction
What is linear regression?
– Model data using a straight line
– Quantitative response
– Quantitative or categorical explanatory
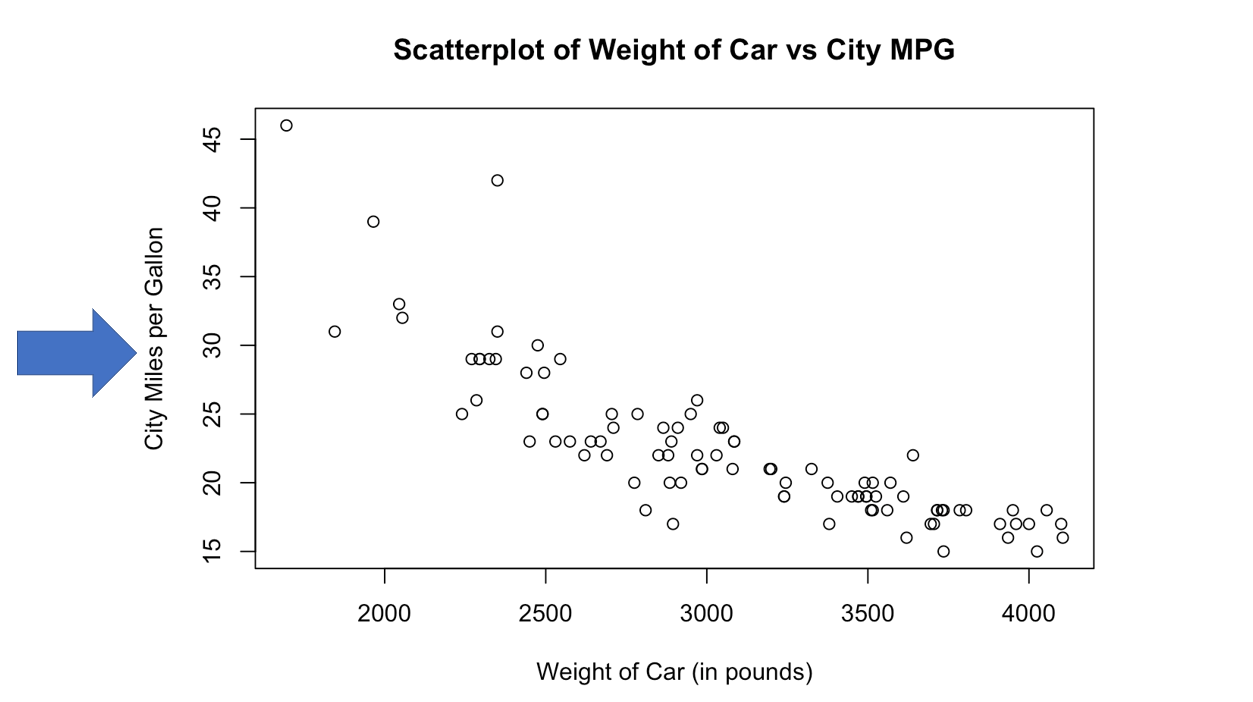
Vocab - Response variable
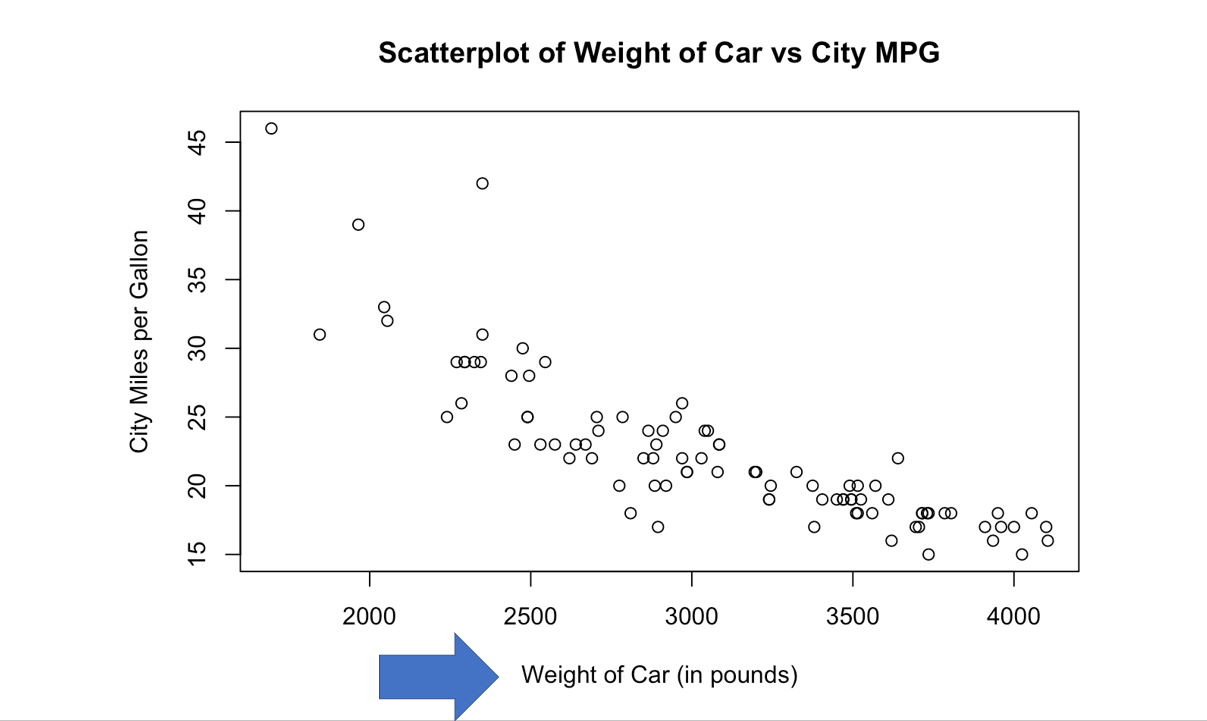
Vocab - Explanatory variable
How are Models Fit? - 2 minutes
How are Models Fit?
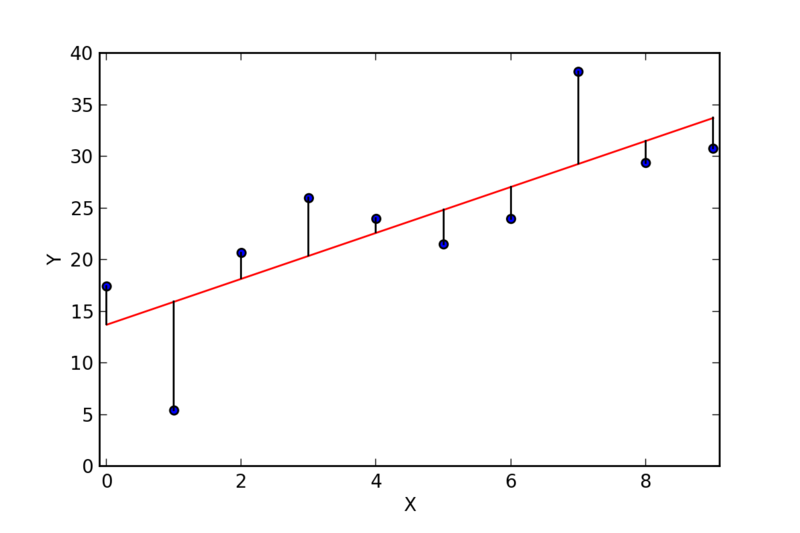
How are Models Fit?
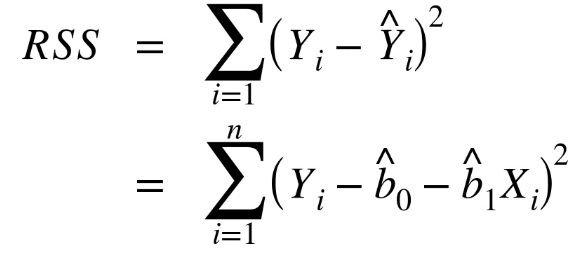
It’s all linear algebra (beyond the scope)
First derivative of \((y-XB)`(y-XB)\)
… and set it equal to 0 to find the set of betas that minimizes RSS
What about when X is categorical?
What about when X is categorical?
In R: SLR
linear_reg() |>

     set_engine("lm") |>

     fit(y ~ x , data = data-set ) |>

     tidy()
ae-11
Model Notation - Population
\[ Y_i = \beta\_o + \beta\_1x_i +\epsilon\_i\]
\[ Y\; - True\; mean\;response \]
\[\beta\_o\; -True\; intercept\]
\[\beta\_1\; - True\; slope\; coefficient\]
\[\epsilon\_i\; - Error\; term\; for\; each\; observation\; i\]
Model Notation - Estimated
\[\hat{Y} = b + b_1x\]
\[\hat{Y} = \hat{\beta_o} + \hat{\beta_1}x\]
\[\hat{Y} - estimated\; (predicted)\; mean \;response\] \[\hat{\beta_o} - estimated\; intercept\] \[\hat{\beta_1} - estimated\; slope\] We assume that our error term is normally distributed and has a mean of 0. Thus, it does not show up in our model.
Model Notes
Things to note:
X is our explanatory variable and is not random. We know the value of X.
Y is our response variable. For a fixed X, Y will be a random variable (have a random outcome).
This random outcome is observed based on a random draw from a distribution we assume.
When using this model for prediction, we expect Y to take on the most likely value for a given X… which is the center of the distribution.
Let’s draw it out…
Takeaway
So, for an observed X….. we are modeling the mean of the distribution of Y
Or, Y is a mean response
“we estimate a mean change in Y”
“we estimate, on average…..”
This is extremely important when we think about interpretation
Is the predictor any good?
– Correlation and r-squared
Correlation (r)
– Between [-1,1]
– Measures the strength and direction of a linear relationship
– We can calculate correlation using the cor function in R
r-squared
– For SLR, r-squared is the correlation coefficient squared
– Quantifies the amount of variability in our response y that is explained by x
– In general, the higher the value is, the better or important the predictor is!
– Note: We do need to be careful with over fitting, and want to be wary of r-squared values close to one. More on this later….
r-squared
We can calculate this in R using glance(model.name)$r.squared
Summary
– Y is a random variable.
– We assume that observations from this random variable are normally distributed.
– Because of this distributional assumption, we are modeling the mean of Y and not just Y.
Wrap up: Check yourself
– What is a model?
– What are the 2 main reasons we fit models?
– Slope coefficients? Intercepts?
– How does linear regression change when x is quantitative vs categorical?