SLR + MLR
Day 9
Dr. Elijah Meyer
Duke University
STA 199 - Summer 2023
June 6th 2023
Checklist
– Clone `ae-09
– Homework 3 Release Today
– Lab 4 due Thursday (11:59)
— 1 submission. Attach everyone to it
Lab 4
– Team Submission
– Attach ALL team members to submission on Gradescope
– Communicate!
– “It was my responsibility to turn the lab in and I forgot….”
Warm Up: Correlation
– Proper notation?
– Definition?
– Bounds?
Challenge your friends to a game of guess the correlation
Warm Up
Last time, we fit a model that investigated the effect of Island on a penguin’s body mass. The results are below:

Let’s write out the estimated model together as a class…
Correlation
Can find this with the cor or correlate function in R

https://www.tidyverse.org/blog/2020/12/corrr-0-4-3/
Warm Up 3
Define each of these terms below:
\(\beta_0\)
\(\beta_1\)
\(b_0\)
\(b_1\)
\(\epsilon\)
\(\hat{y}\)
Multiple Linear Regression
estimates the relationship between a quantitative response variable and two or more explanatory variables
motivated by scenarios where many variables may be simultaneously connected to an output
Multiple Linear Regression
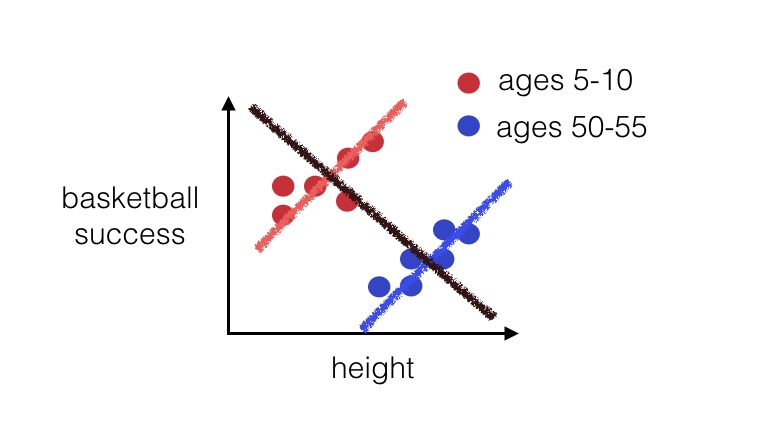
Slight Change in interpretation
– Holding all else constant
Because we estimate our coefficients all at the same time. Thus, when we add variables to the model, our estimates will change!
Beyond the scope
– Linear algebra is driving what we do in R
– Least squares estimator: estimating parameters by minimizing the squared discrepancies between observed data
– \[\hat{\beta} = (X^t X)^{-1} X^tY\]
Additive Model vs Interaction Model
In words….
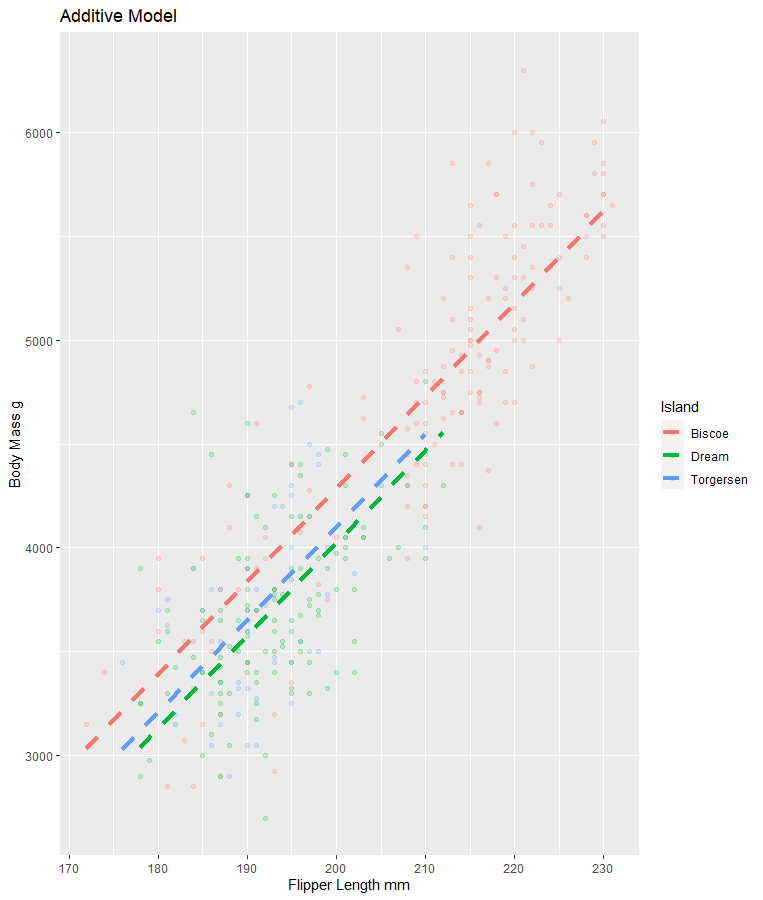
The relationship between x and y do not change based on the values of z (additive)
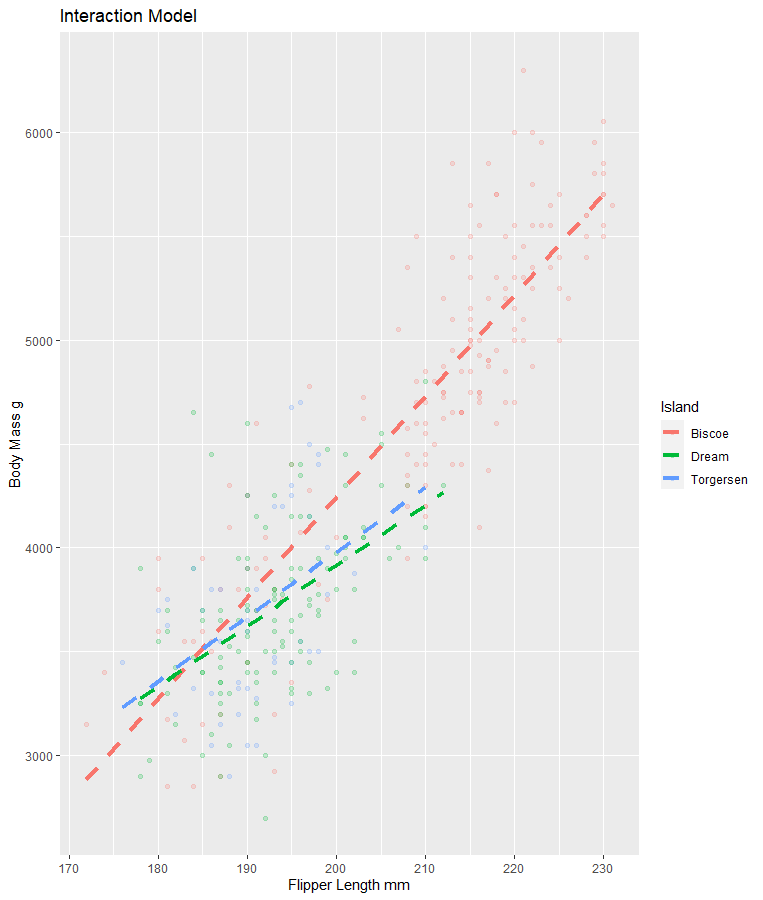
The relationship between x and y DO change based on the values of z (interaction)
Additive Model for Today
Interaction Model for Today
ae-09
Principle of parsimony (Occam’s Razor)
for a statistical model states that: a simpler model with fewer parameters is favored over more complex models with more parameters, provided the models fit the data similarly well
KEEP IT SIMPLE (when you can)
So how do we choose?
Many different ways
– Initial visual evidence
– R-squared & Adjusted R-squared
R-squared
– statistical measure in a regression model that determines the proportion of variance in the response variable that can be explained by the explanatory variable(s).
R-squared
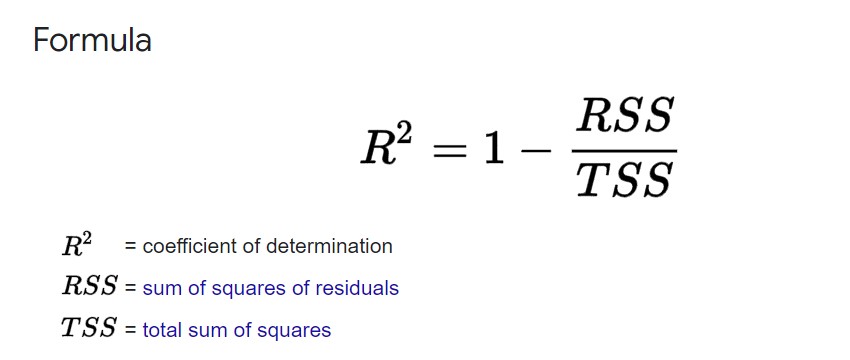
R-squared
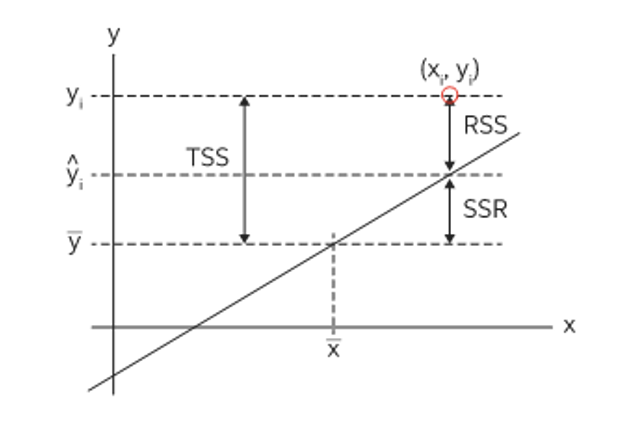
R-squared: Takeaway
– statistical measure in a regression model that determines the proportion of variance in the response variable that can be explained by the explanatory variable(s).
– The more variables you include, the larger the R-squared value will be (always)
Adjusted R-squared
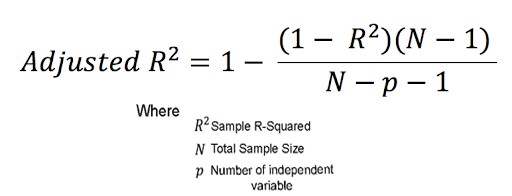
Takeaway: Adds a penalty for “unimportant” predictors (x’s)
ae-09
