Data Ethics + Extension Topics
Day 16
Dr. Elijah Meyer
Duke University
STA 199 - Summer 2023
June 26th, 2023
Checklist
– Clone ae-extensions
– Homework 4 is Live (Due 6-26)
– Project Final Draft Due 11:59 Thursday (6-29)
– Final Presentation (6-29)
– Group Feedback Survey-2 in Sakai Due Tonight
– No Feedback Survey-3. Expectation is to reach out..
– Instructor Evaluations
– Check out some r-shiny apps: https://shiny.rstudio.com/gallery/
Questions about the project
– When / What / How?
– Expectations
– Strategies
– etc.
- Give me notice; Can be flexible to meet
Data Ethics (Abbreviated)
– Could be it’s own course
– Data Misrepresentation
– Data Privacy
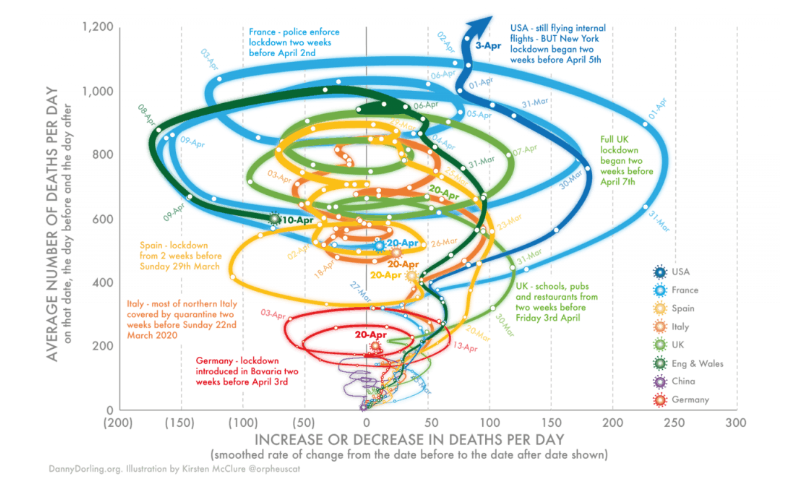
Data Misrepresentation
What’s going on with this graph?
![]()
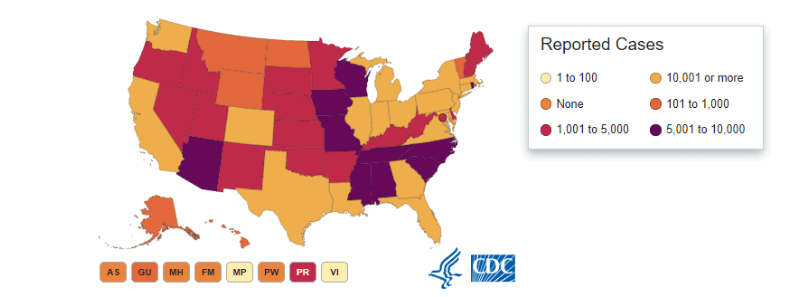
Data Misrepresentation
How do we effectively communicate data?
![]()
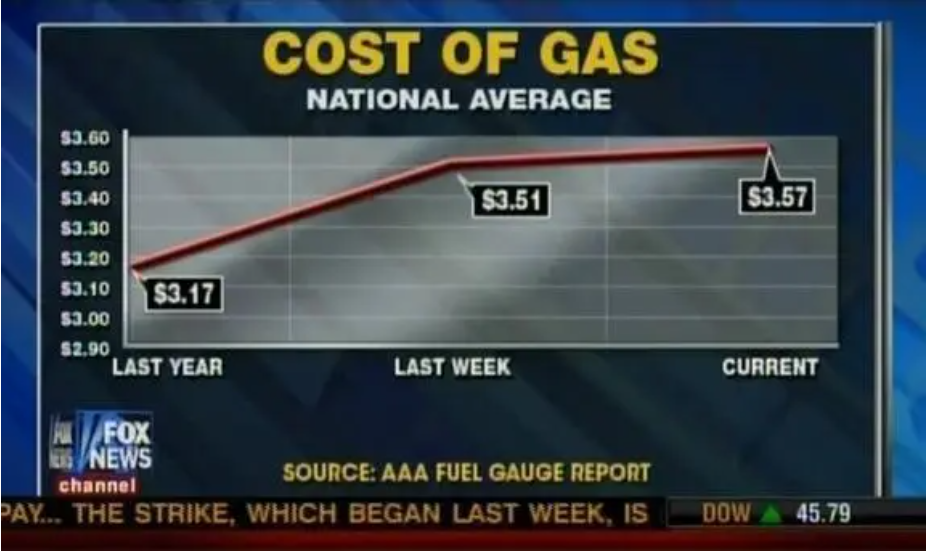
Data Misrepresentation
How do we effectively communicate data?
![]()
General Strategies
– Represent percentages as parts of a whole
– Do not misrepresent time on the axes
– Pay attention to data types, e.g., represent time as time on a continuous scale, not years as levels of a categorical variable
– Prefer direct labeling over legends
– Use accessible colors
– Pick a purpose and label, color, annotate for that purpose
– Communicate your main message directly in the plot labels
– Simplify before you call it done
Misleading with Techniques
![]()
A team of German researchers had found that people on a low-carb diet lost weight 10 percent faster if they ate a chocolate bar every day.
We ran an actual clinical trial, with subjects randomly assigned to different diet regimes. And the statistically significant benefits of chocolate that we reported are based on the actual data. It was, in fact, a fairly typical study for the field of diet research.
The Study
5 men and 11 women showed up, aged 19 to 67. . . . After a round of questionnaires and blood tests to ensure that no one had eating disorders, diabetes, or other illnesses that might endanger them, Frank randomly assigned the subjects to one of three diet groups. One group followed a low-carbohydrate diet. Another followed the same low-carb diet plus a daily 1.5 oz. bar of dark chocolate. And the rest, a control group, were instructed to make no changes to their current diet. They weighed themselves each morning for 21 days, and the study finished with a final round of questionnaires and blood tests.
The Hoax
“One beer-fueled weekend later and… jackpot! Both of the treatment groups lost about 5 pounds over the course of the study, while the control group’s average body weight fluctuated up and down around zero. But the people on the low-carb diet plus chocolate? They lost weight 10 percent faster. Not only was that difference statistically significant, but the chocolate group had better cholesterol readings and higher scores on the well-being survey.”
The Hoax
If you measure a large number of things about a small number of people, you are almost guaranteed to get a “statistically significant” result. Our study included 18 different measurements—weight, cholesterol, sodium, blood protein levels, sleep quality, well-being, etc…. from 15 people. . . .
With our 18 measurements, we had a 60% chance of getting some “significant” result with p < 0.05.
I Fooled Millions Into Thinking Chocolate Helps Weight Loss. Here’s How
It was, in fact, a fairly typical study for the field of diet research. Which is to say: It was terrible science. The results are meaningless, and the health claims that the media blasted out to millions of people around the world are utterly unfounded.
Data Ethics + Bias
– You leave a lot of data online to be used…
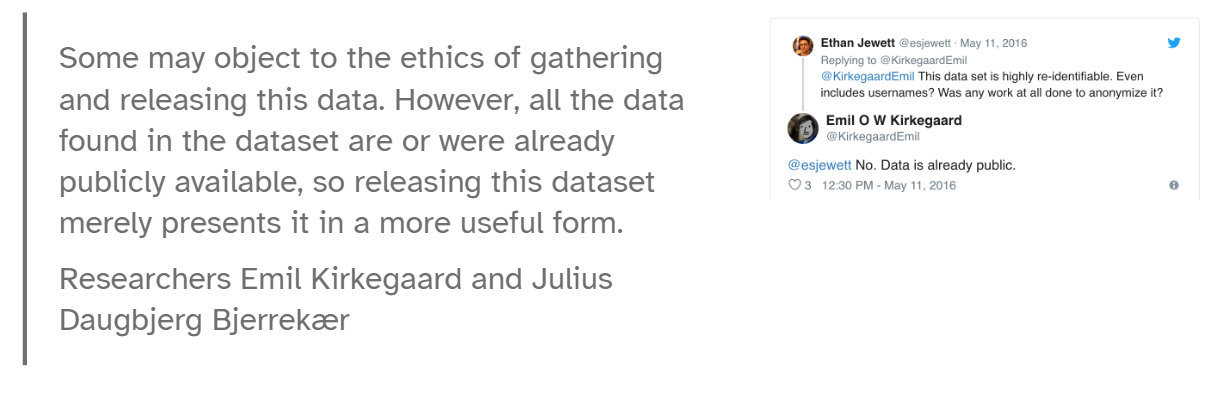
OKcupid Data Breach
– In 2016, researchers published data of 70,000 OkCupid users—including usernames, political leanings, drug usage, and intimate sexual details
– Researchers didn’t release the real names and pictures of OKCupid users, but their identities could easily be uncovered from the details provided, e.g. usernames
![]()
Garbage Data
– In statistical modeling and inference we talk about “garbage in, garbage out” – if you don’t have good (random, representative) data, results of your analysis will not be reliable or generalizable.
– Corollary: Statistical tools don’t fix garbage data
Examples
– Predicting ethnicity to fill in voting maps
– Algorithm used for rating a defendant’s risk of future crime
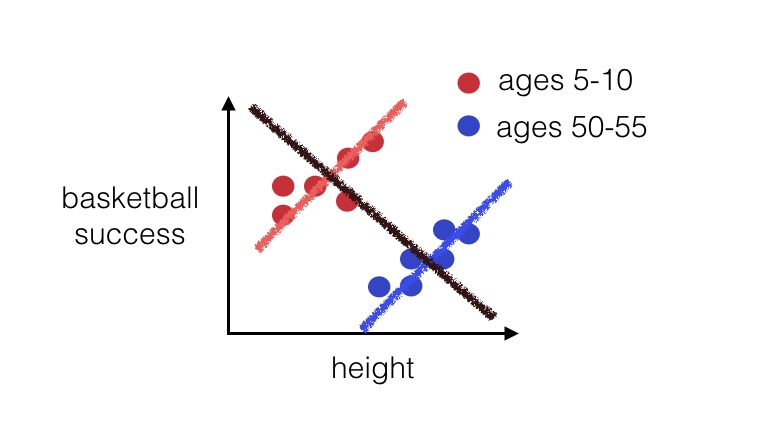
Simpson’s Paradox
![]()
Takeaway
– Think critically about what your data actually measure + what data needs to be collected to try and tell the full story (i.e. confounding variables)
questions?
discussion points?
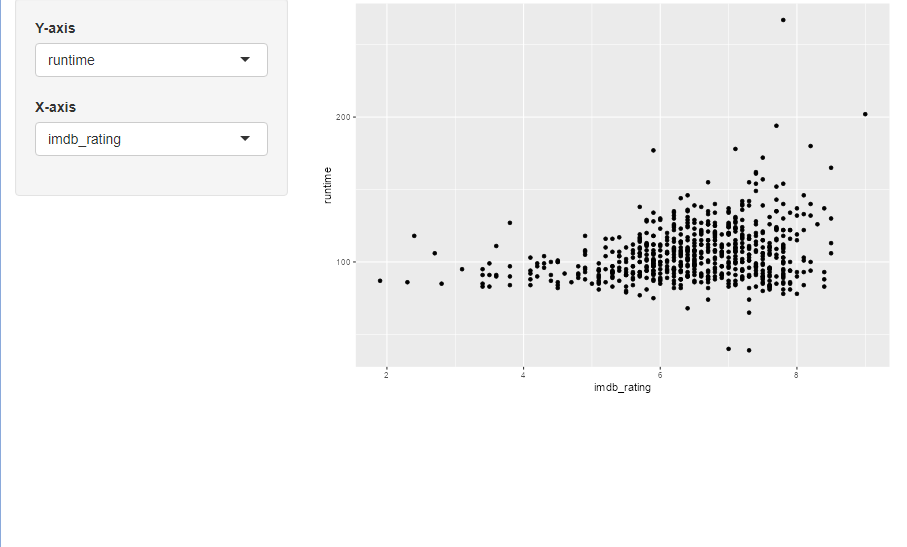
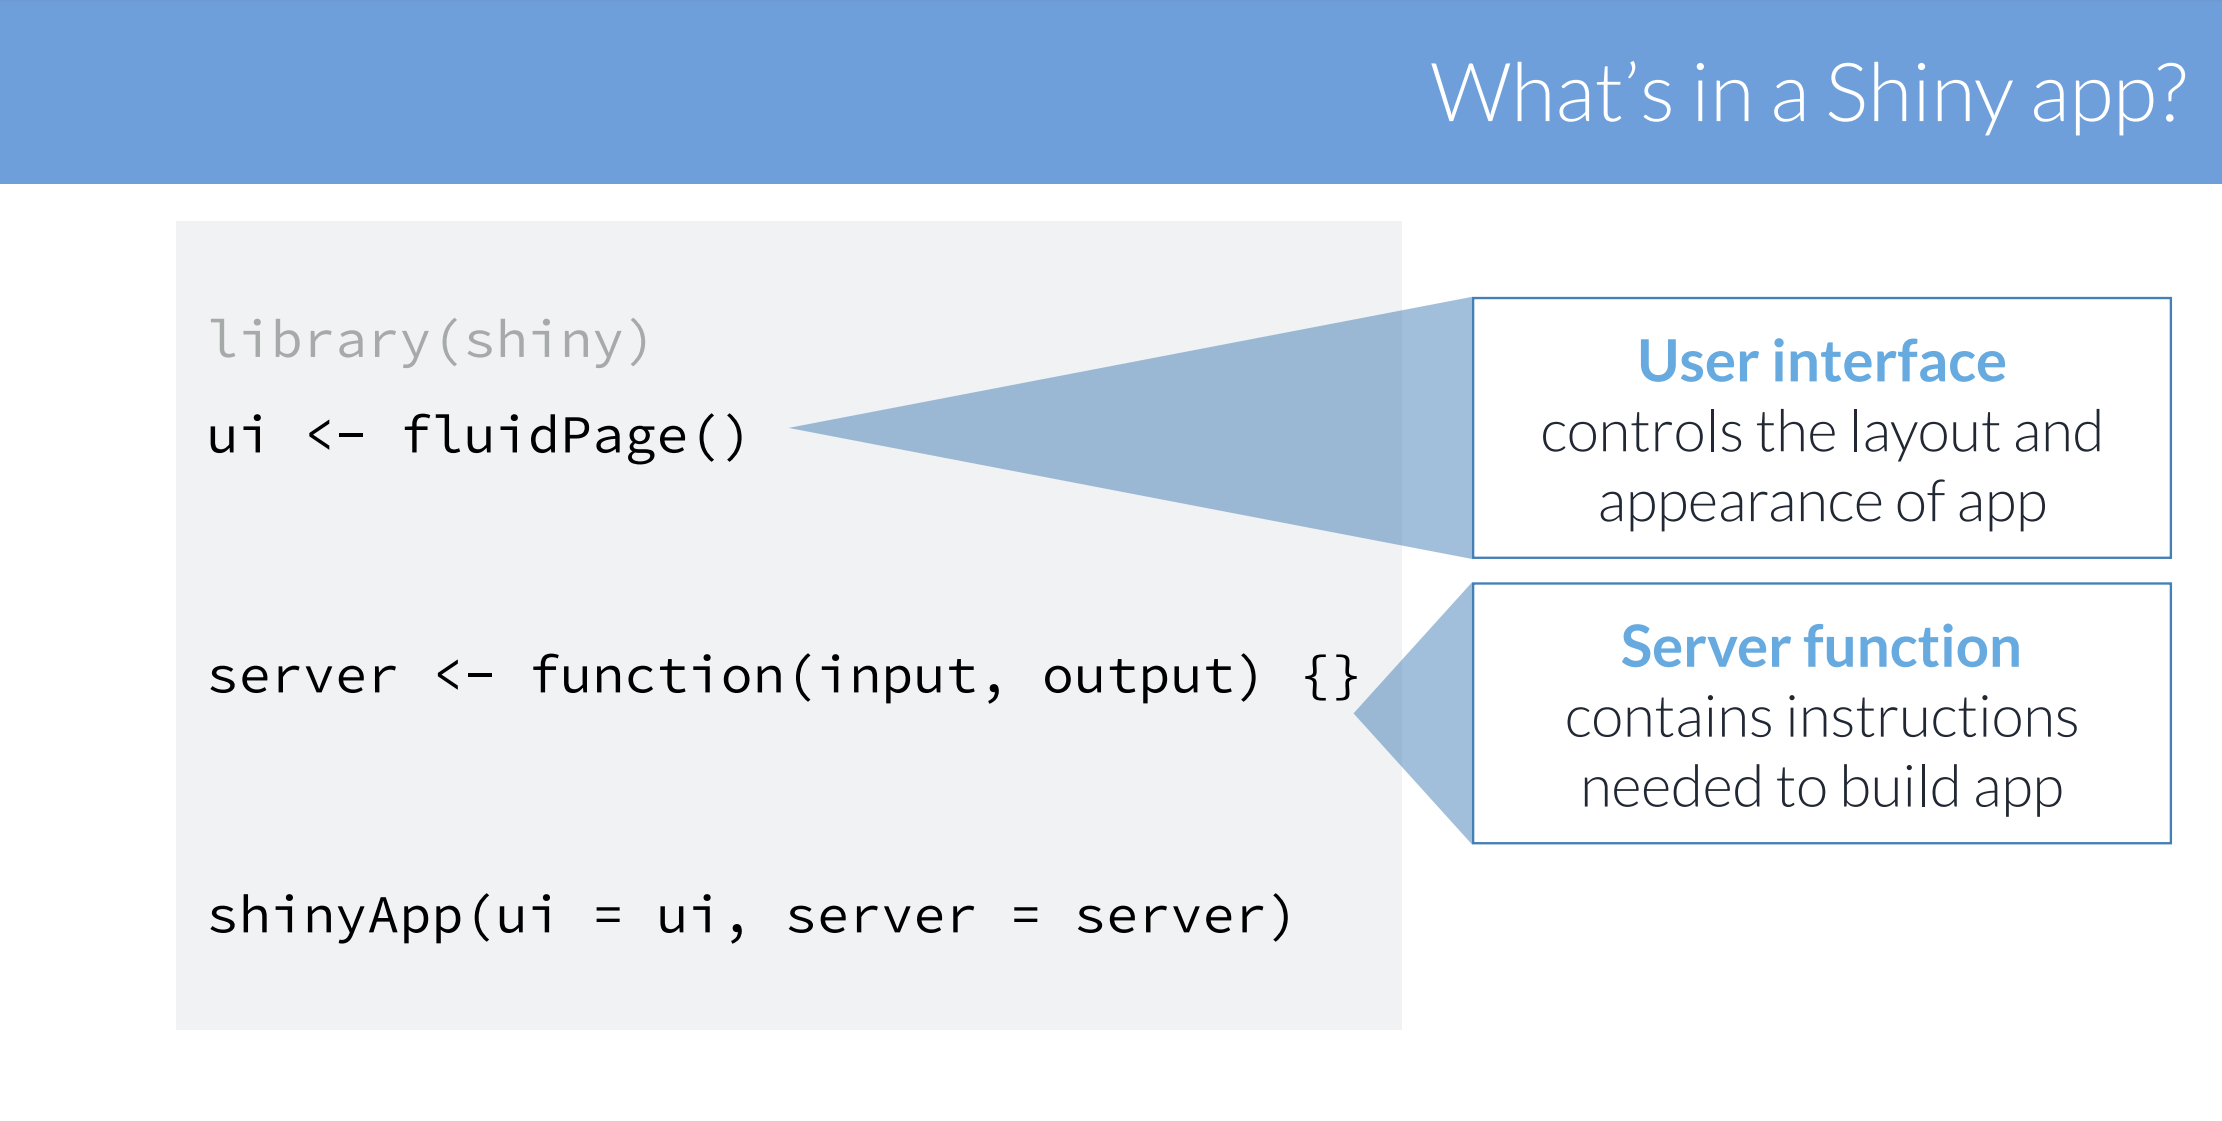
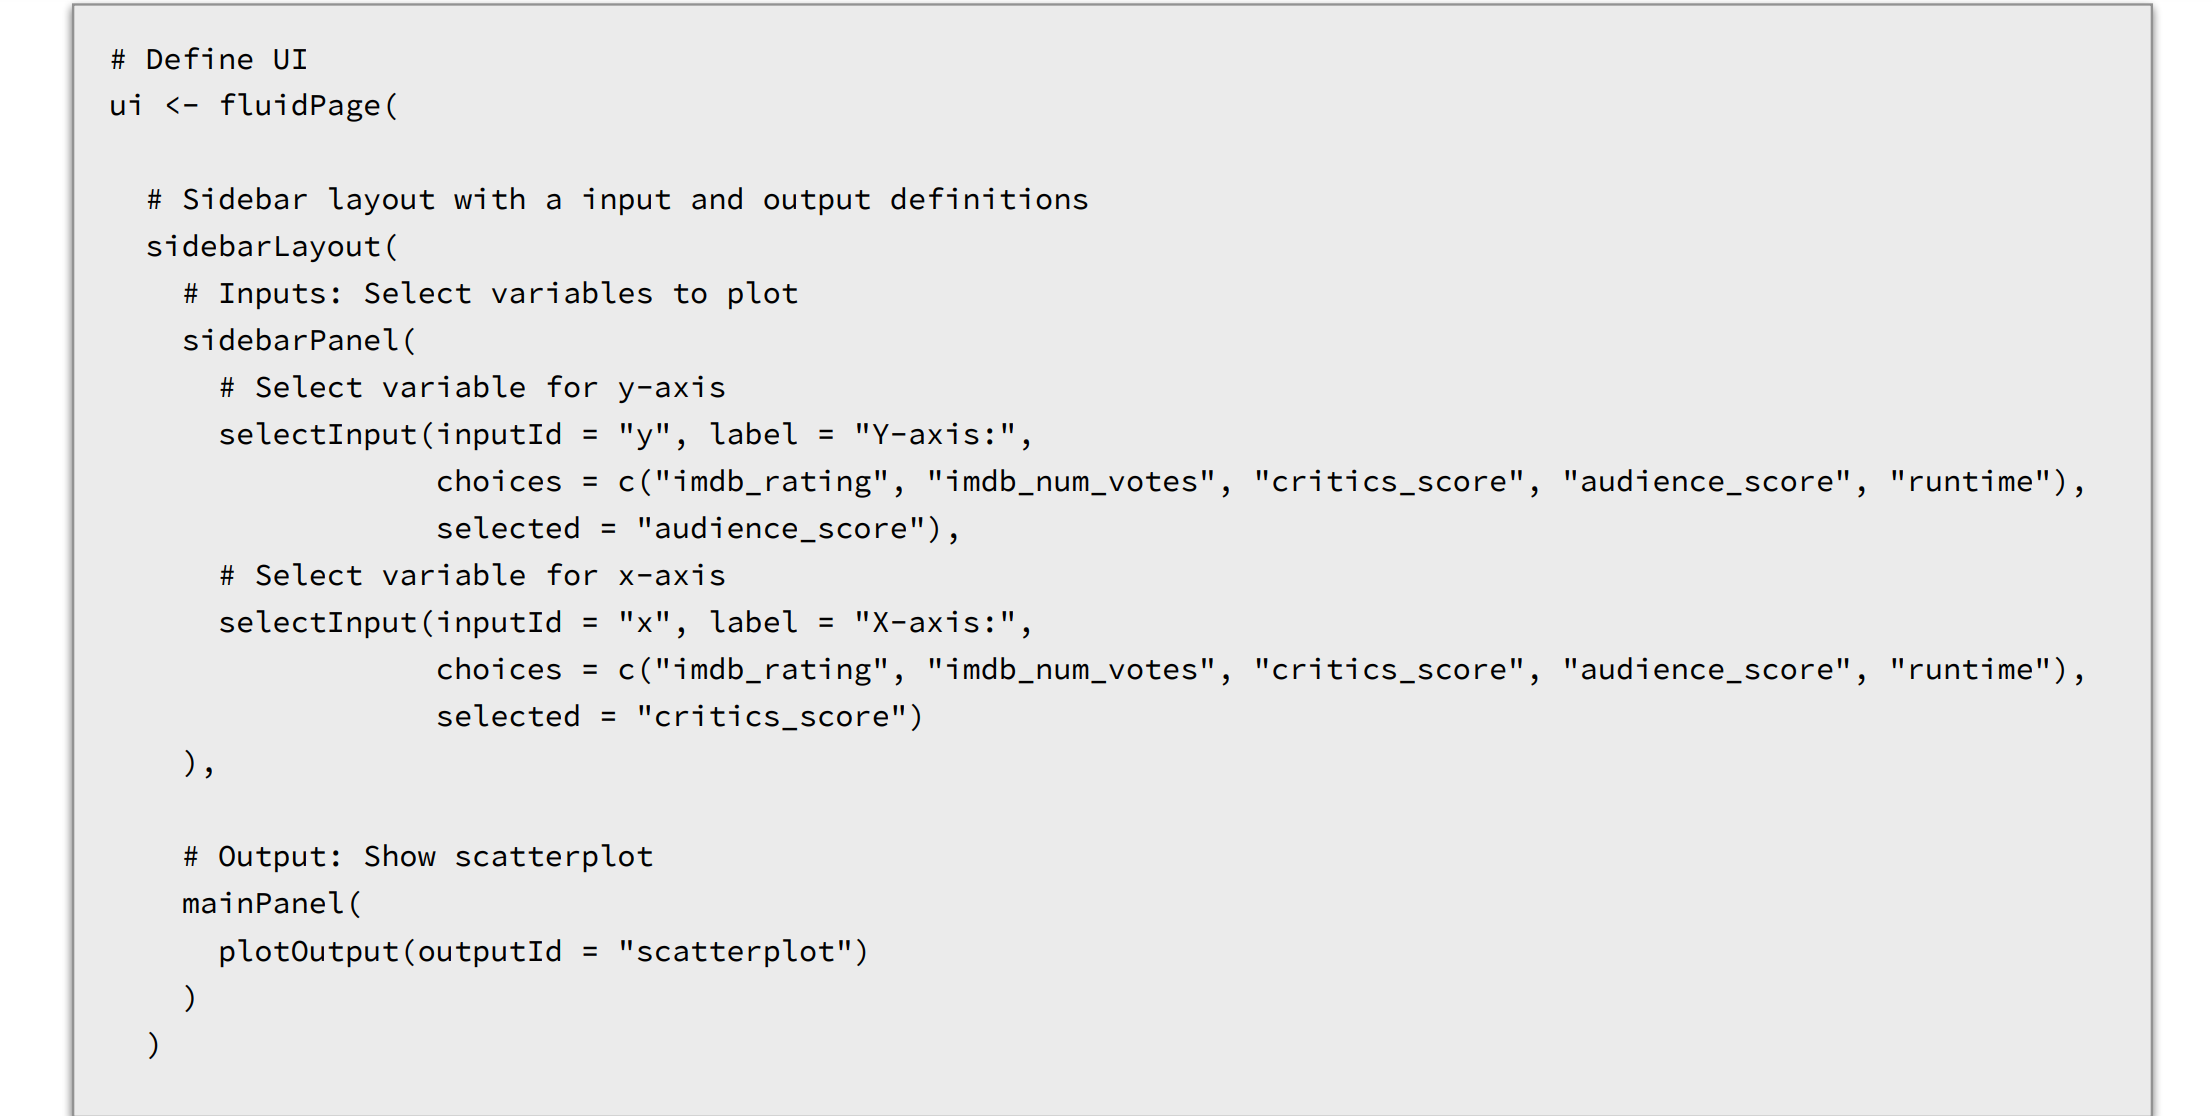
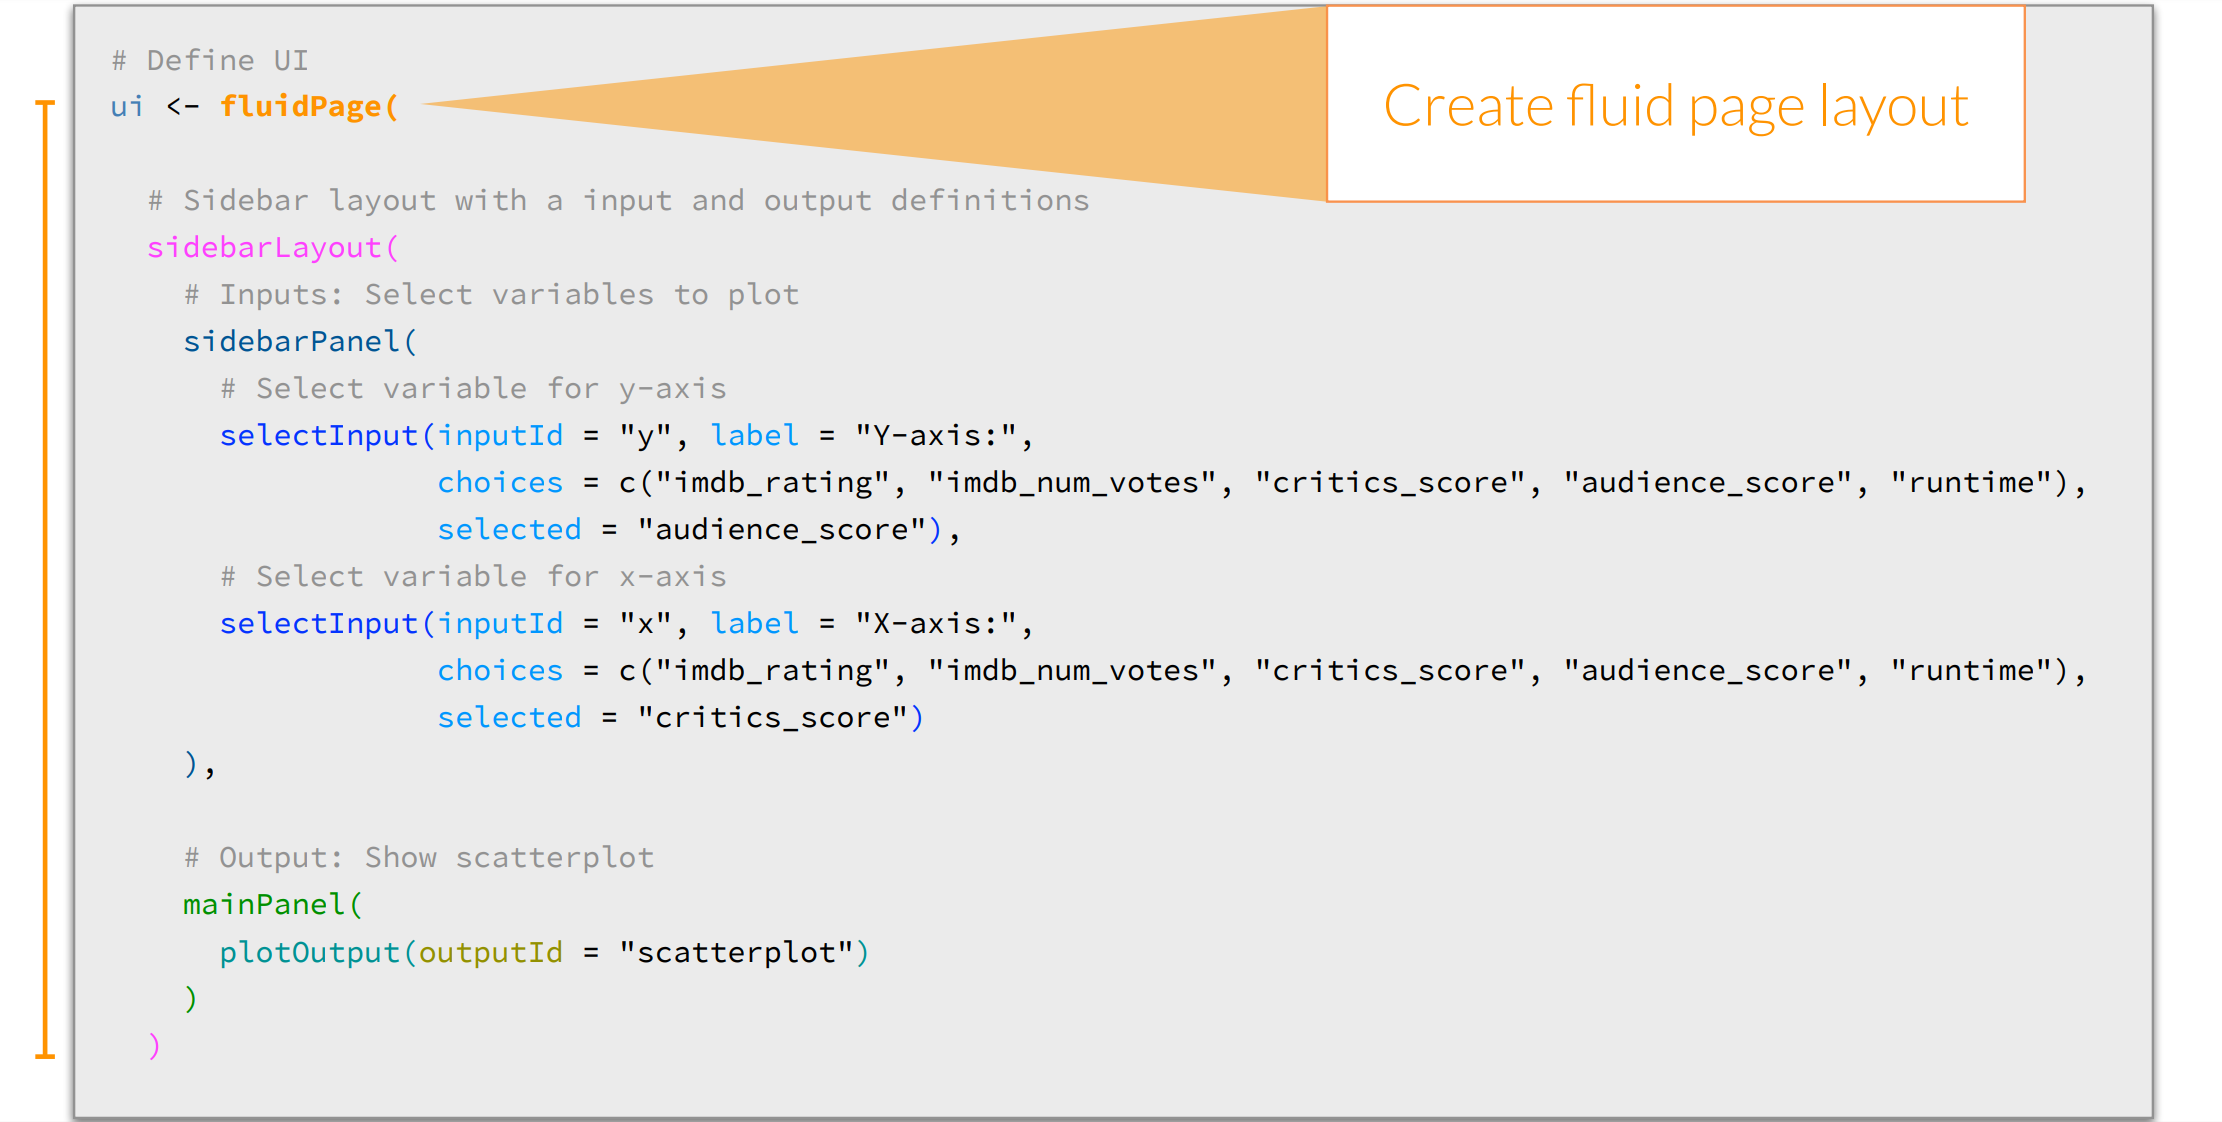
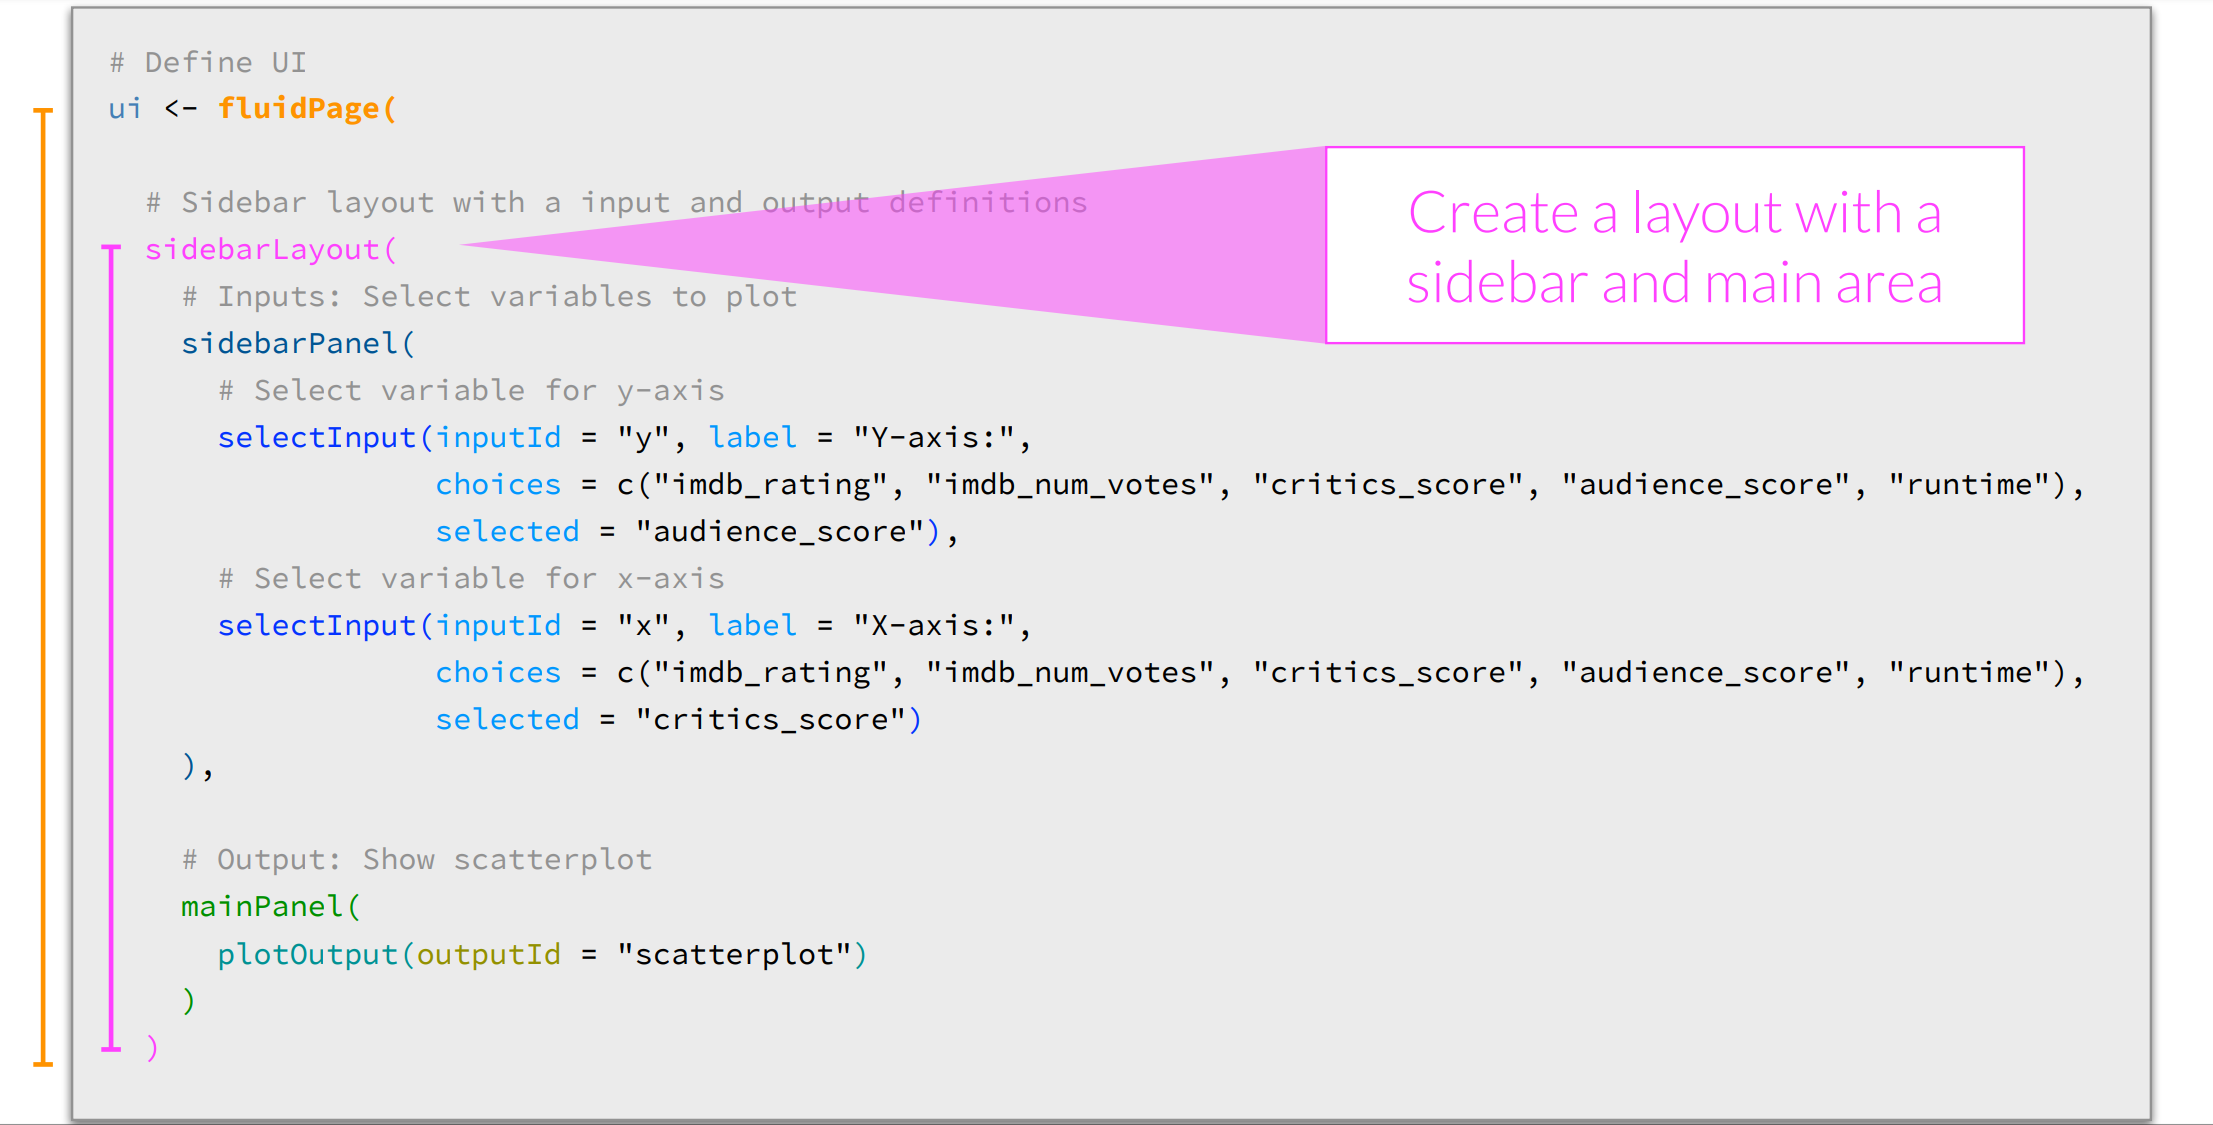
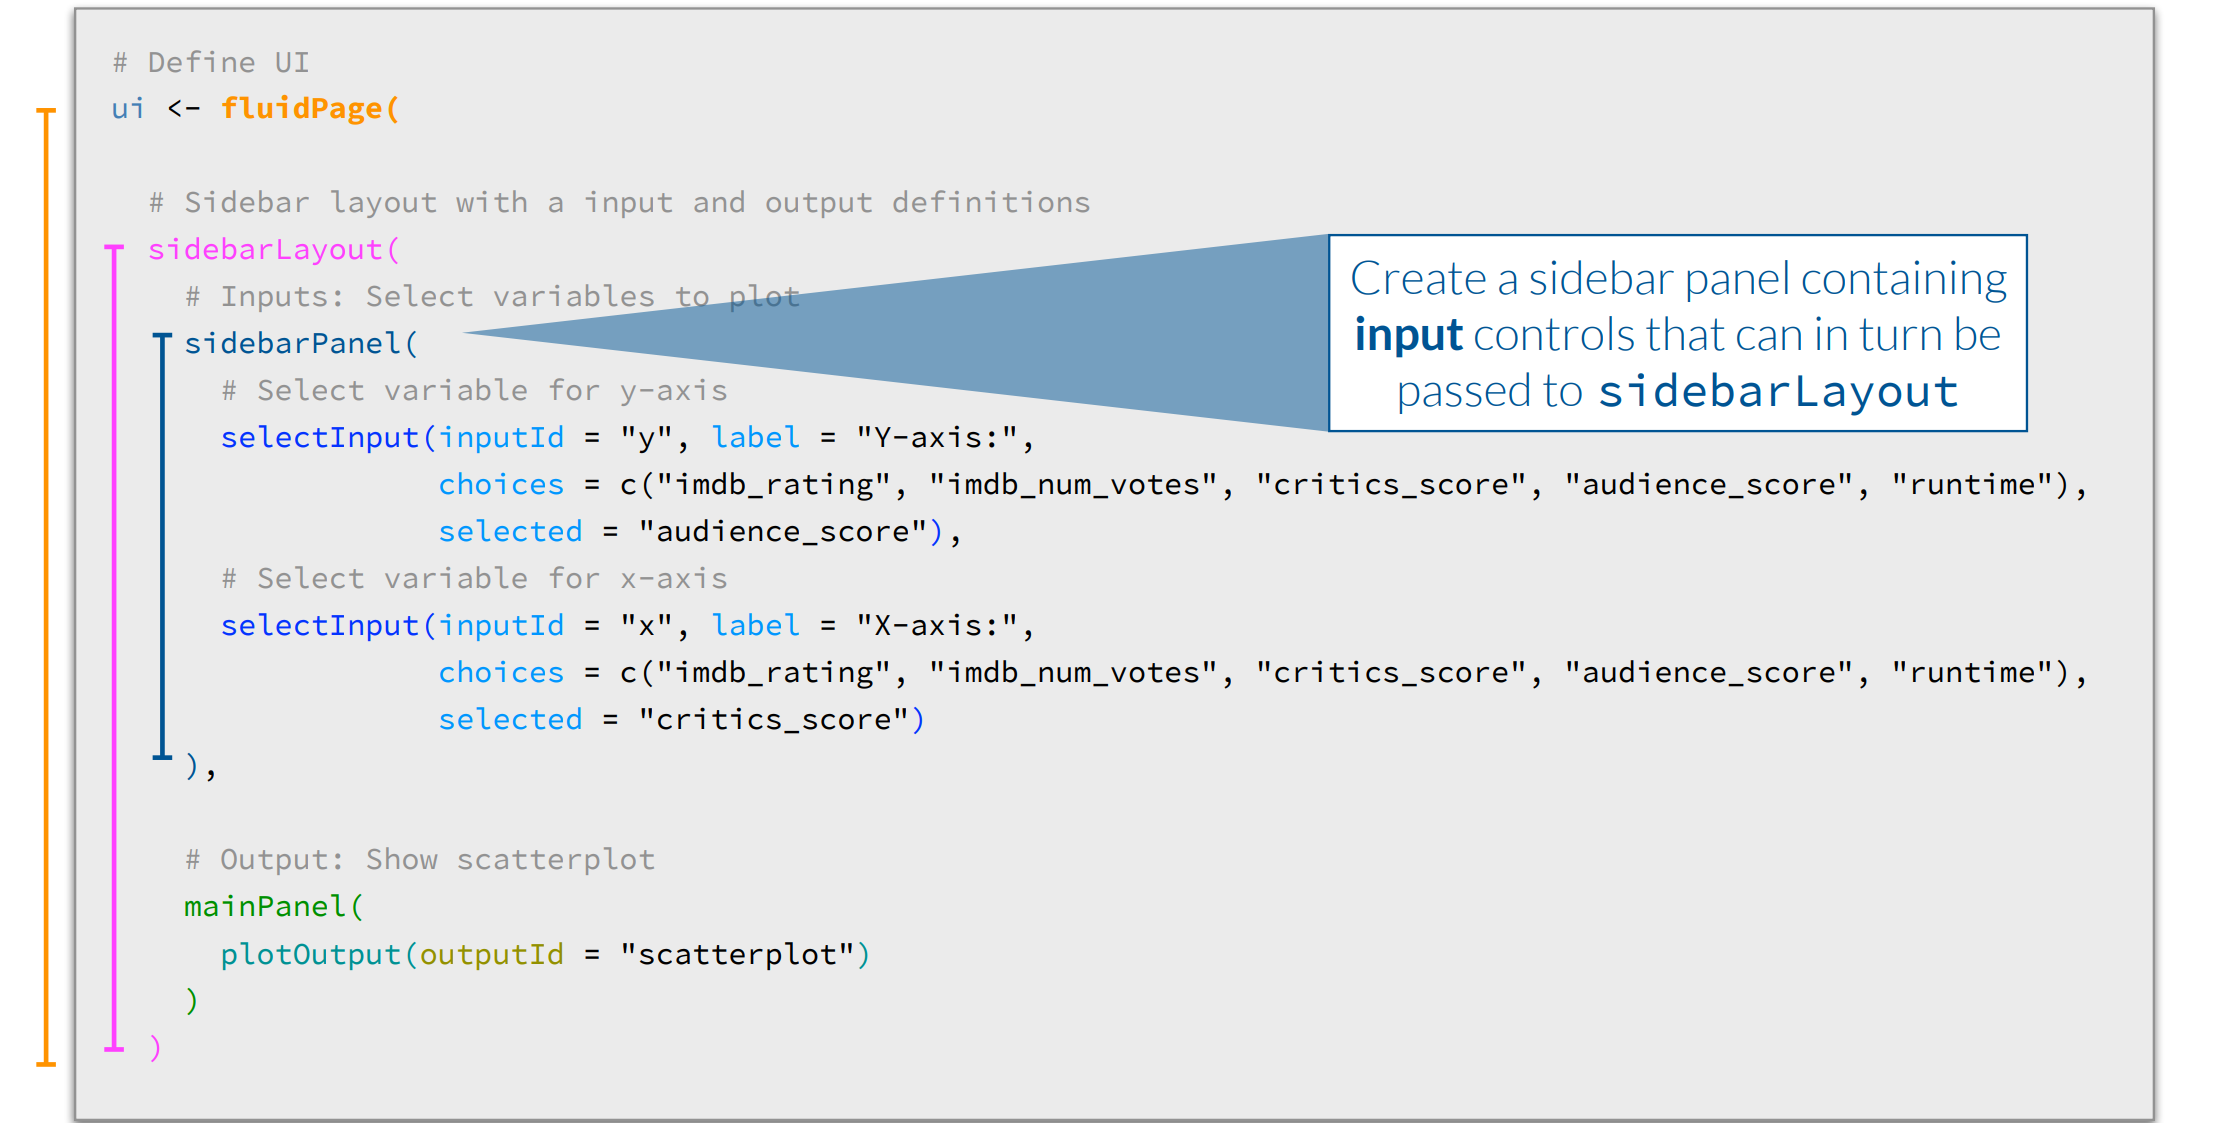
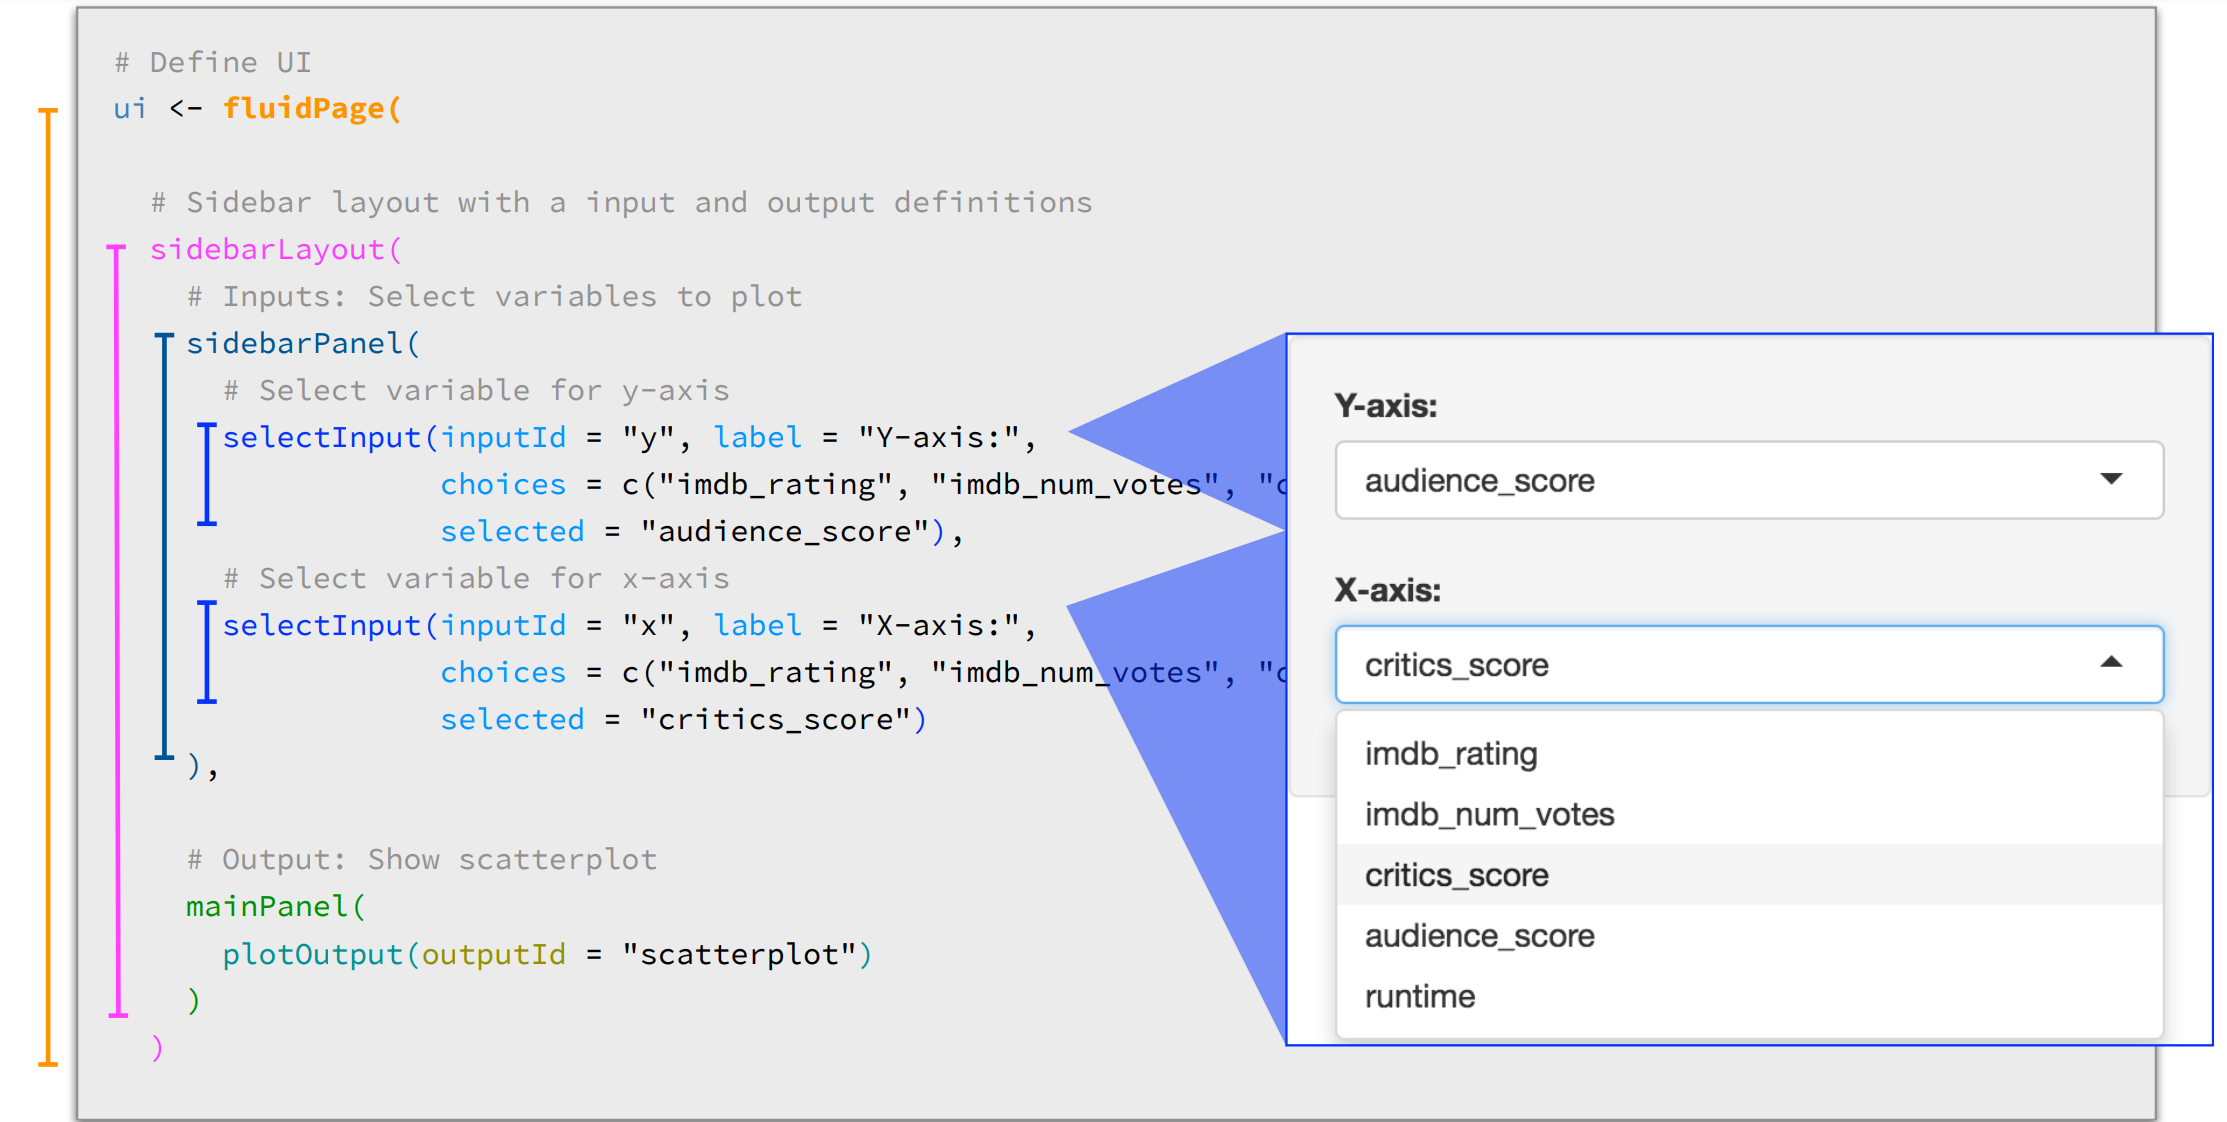
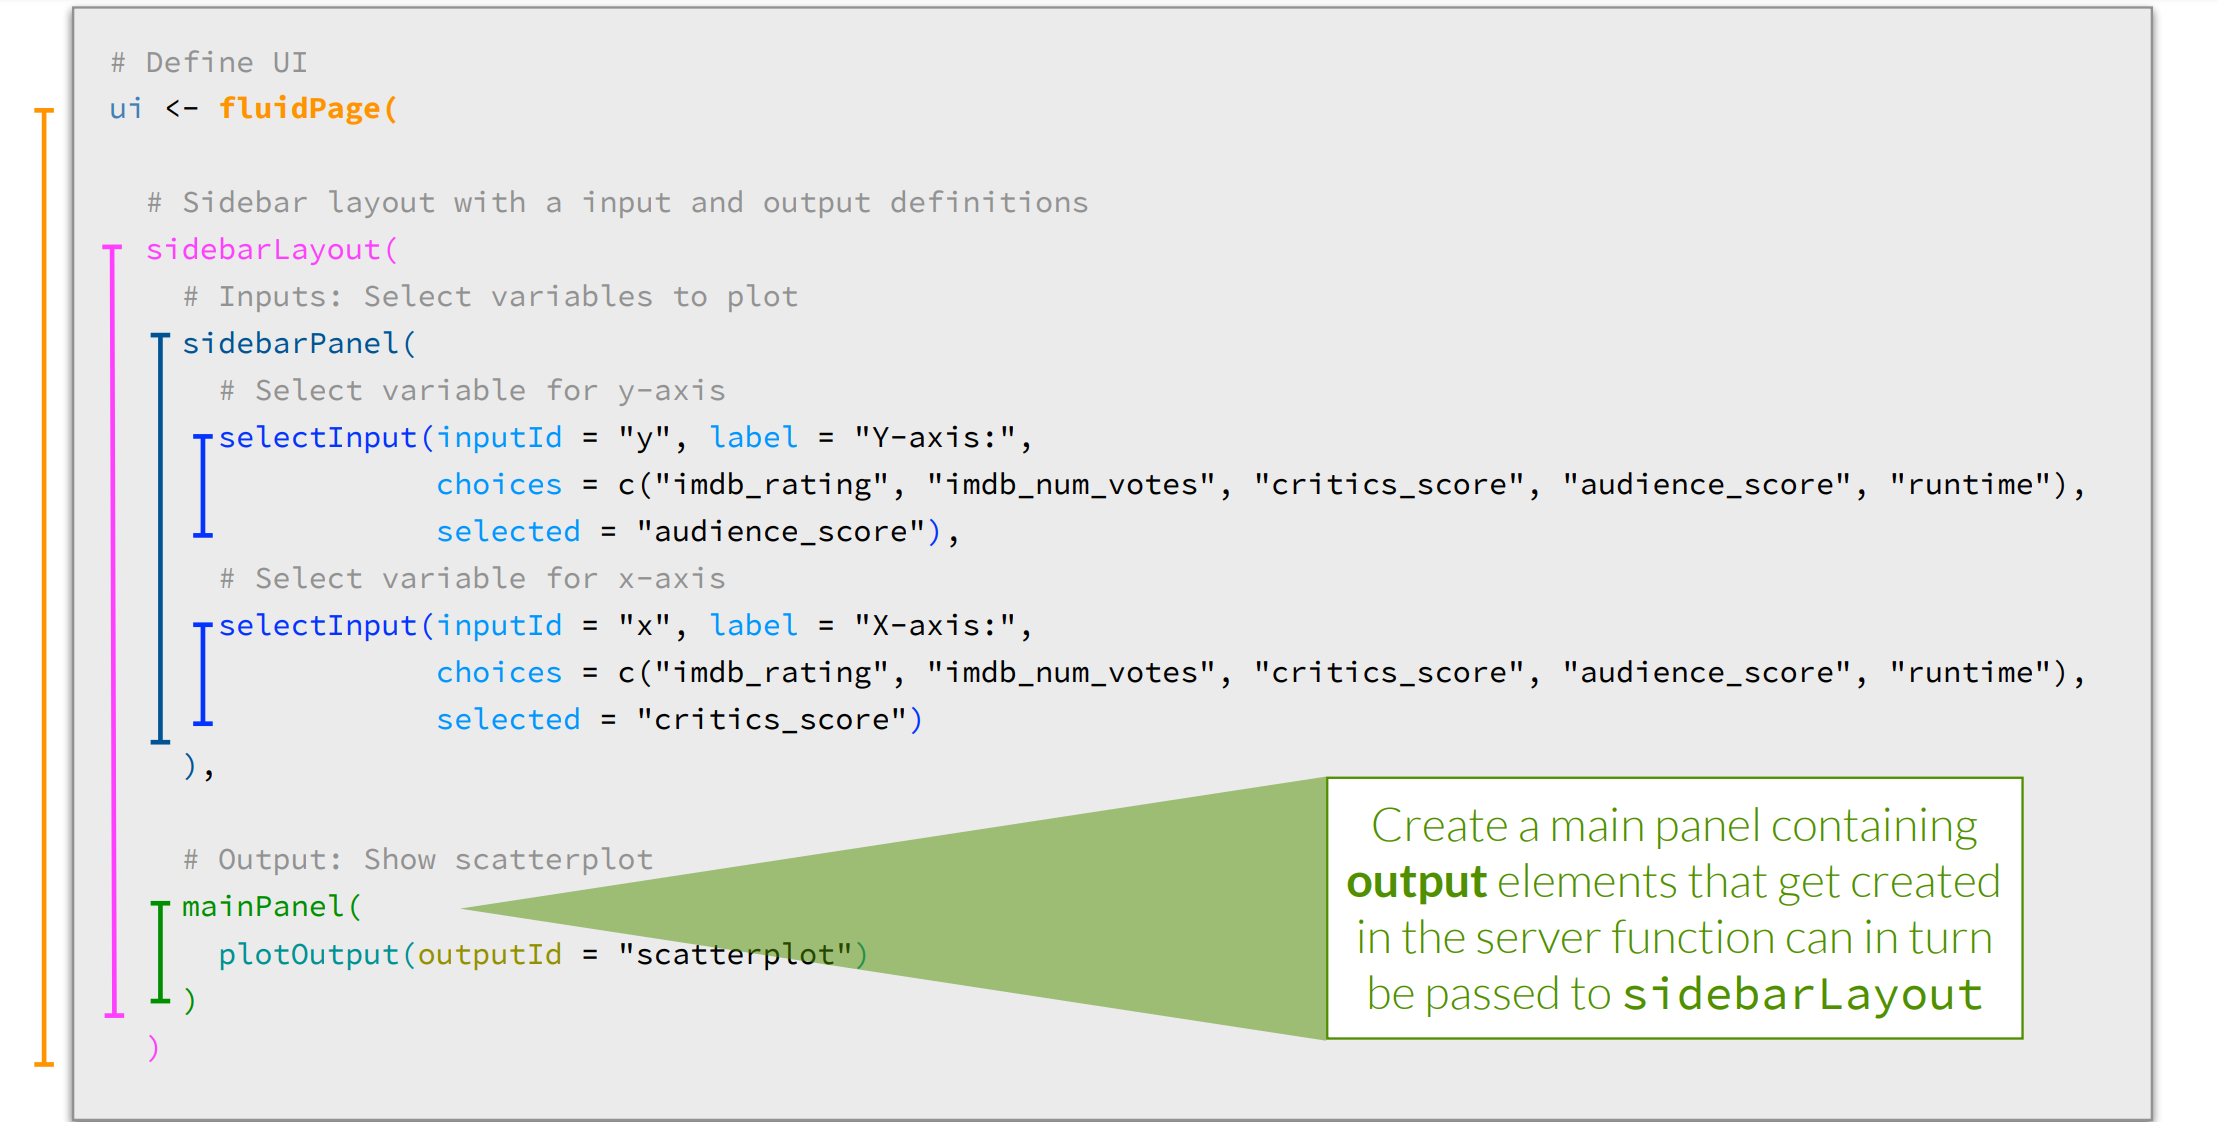
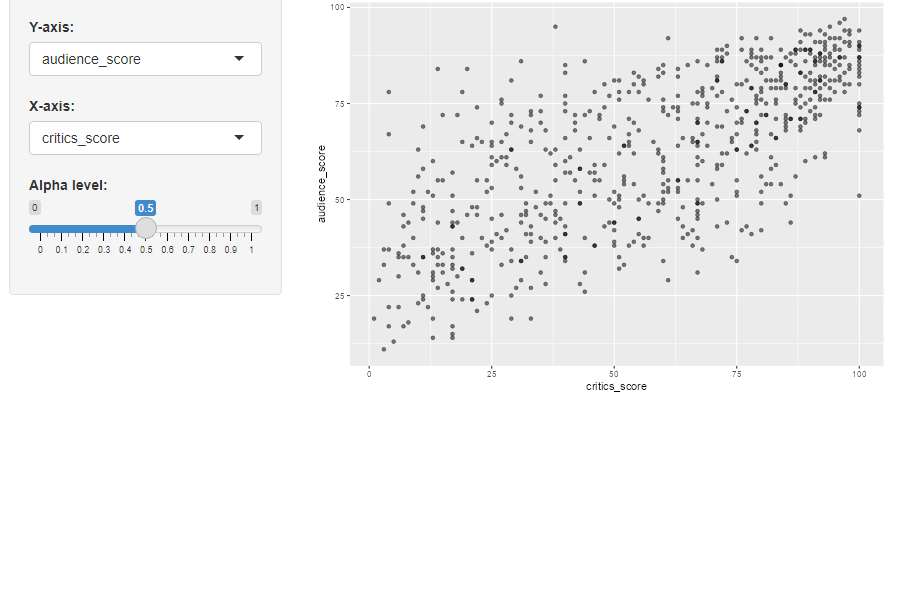
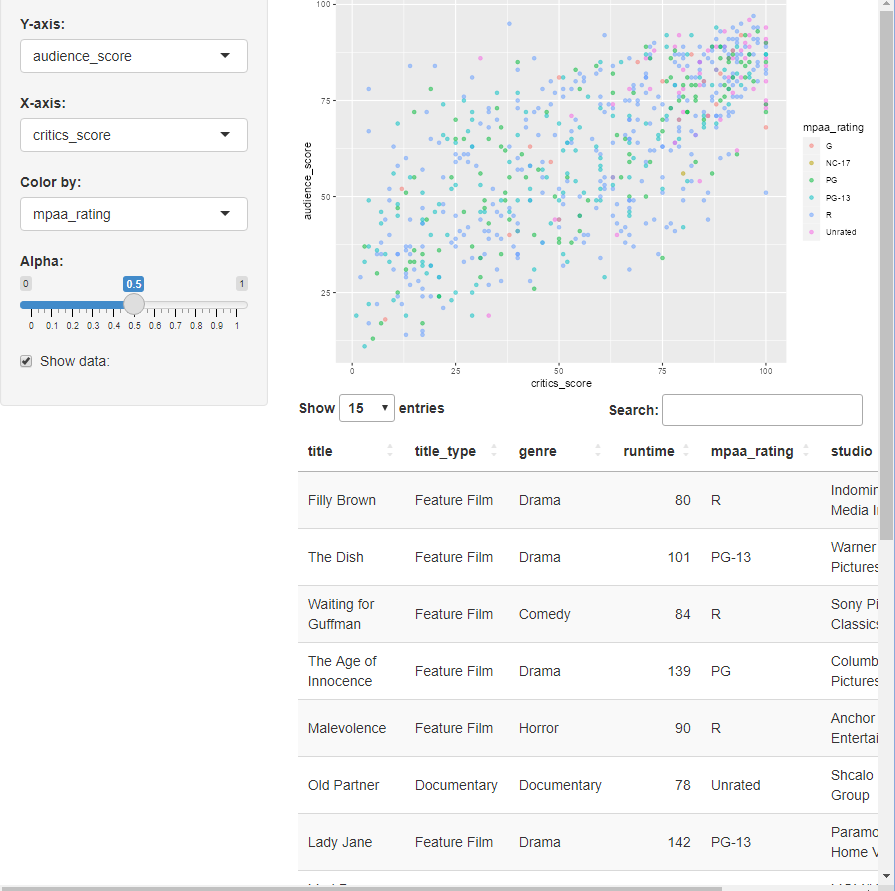
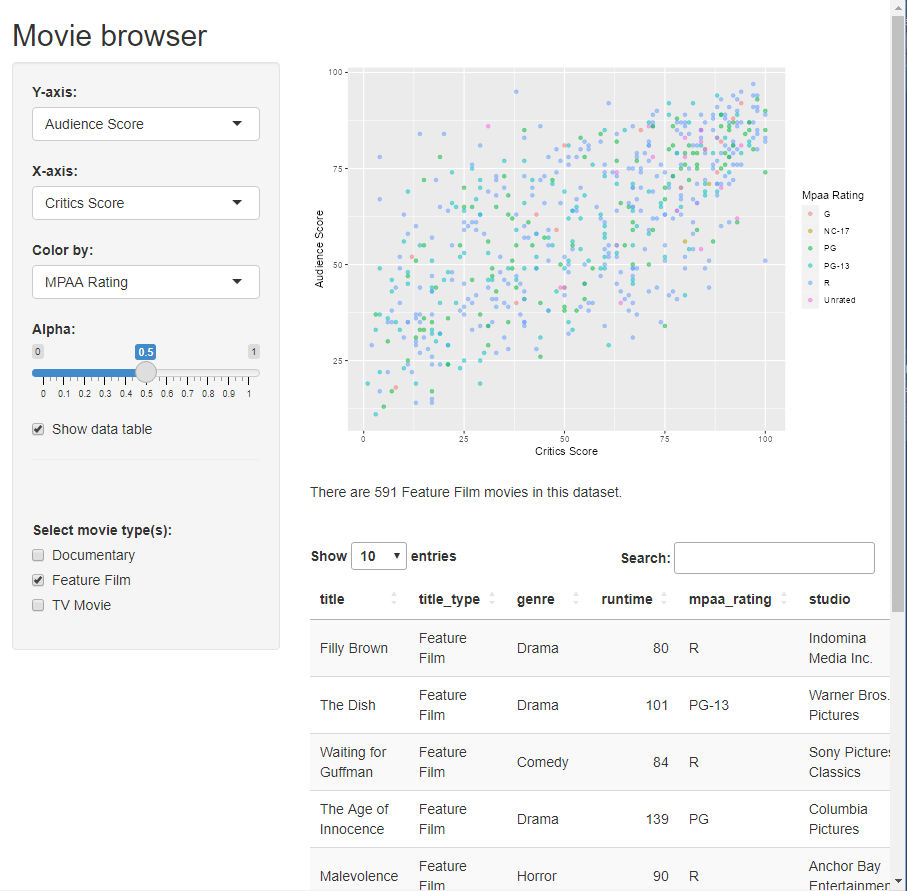
What and Why Shiny?
– Shiny is an R package that makes it easy to build interactive web apps straight from R
– Shiny combines the computational power of R with the interactivity of the modern web
– https://christianstratton.shinyapps.io/batapp/?_ga=2.176377317.1341335816.1666368887-1922592585.1666368887
moives
![]()
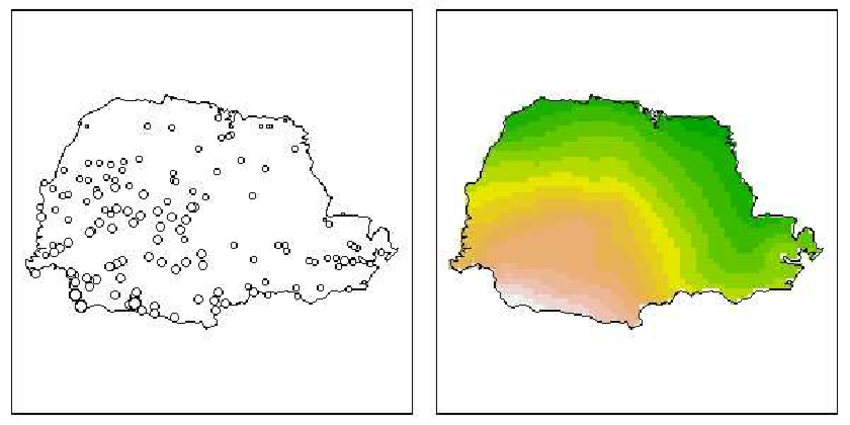
Spatial Modeling Overview
Researchers in many fields are faced with analyzing data with a spatial component. These analyses typically include:
– modeling trends and correlation structures
– estimation of underlying model parameters
– hypothesis testing or model comparison
– prediction of observations at unobserved times or locations
Example
![]()
Thank you!